Summary:
- The SFOX Multi-Factor Market Index remains at mildly bullish entering March 2019.
- LTC’s jump in volatility on February 8th and 9th suggests that the market is still keenly interested in privacy technology.
- Crypto volatility in February reaffirmed market interest in privacy and ETFs, and challenged market interest in J.P. Morgan’s new cryptocurrency.
- Watch Asia Crypto Week and BTC futures expirations to potentially impact crypto volatility in March.
In the February 2019 edition of our monthly volatility report, the SFOX research team has collected price, volume, and volatility data from eight major exchanges and liquidity providers to analyze the global performance of 5 leading cryptoassets — BTC, ETH, BCH, LTC, and ETC — all of which are available for algorithmic trading on our trading platform.
The following is a report and analysis of their volatility, price correlations, and further development in the last month. (For more information on data sources and methodology, please consult the appendix at the end of the report.)
Current Crypto Market Outlook: Mildly Bullish
Based on our calculations and analyses, the SFOX Multi-Factor Market Index, which was set at mildly bullish at the end of January 2019, remains at mildly bullish at the end of February — although the index is now edging slightly more towards the bearish direction.
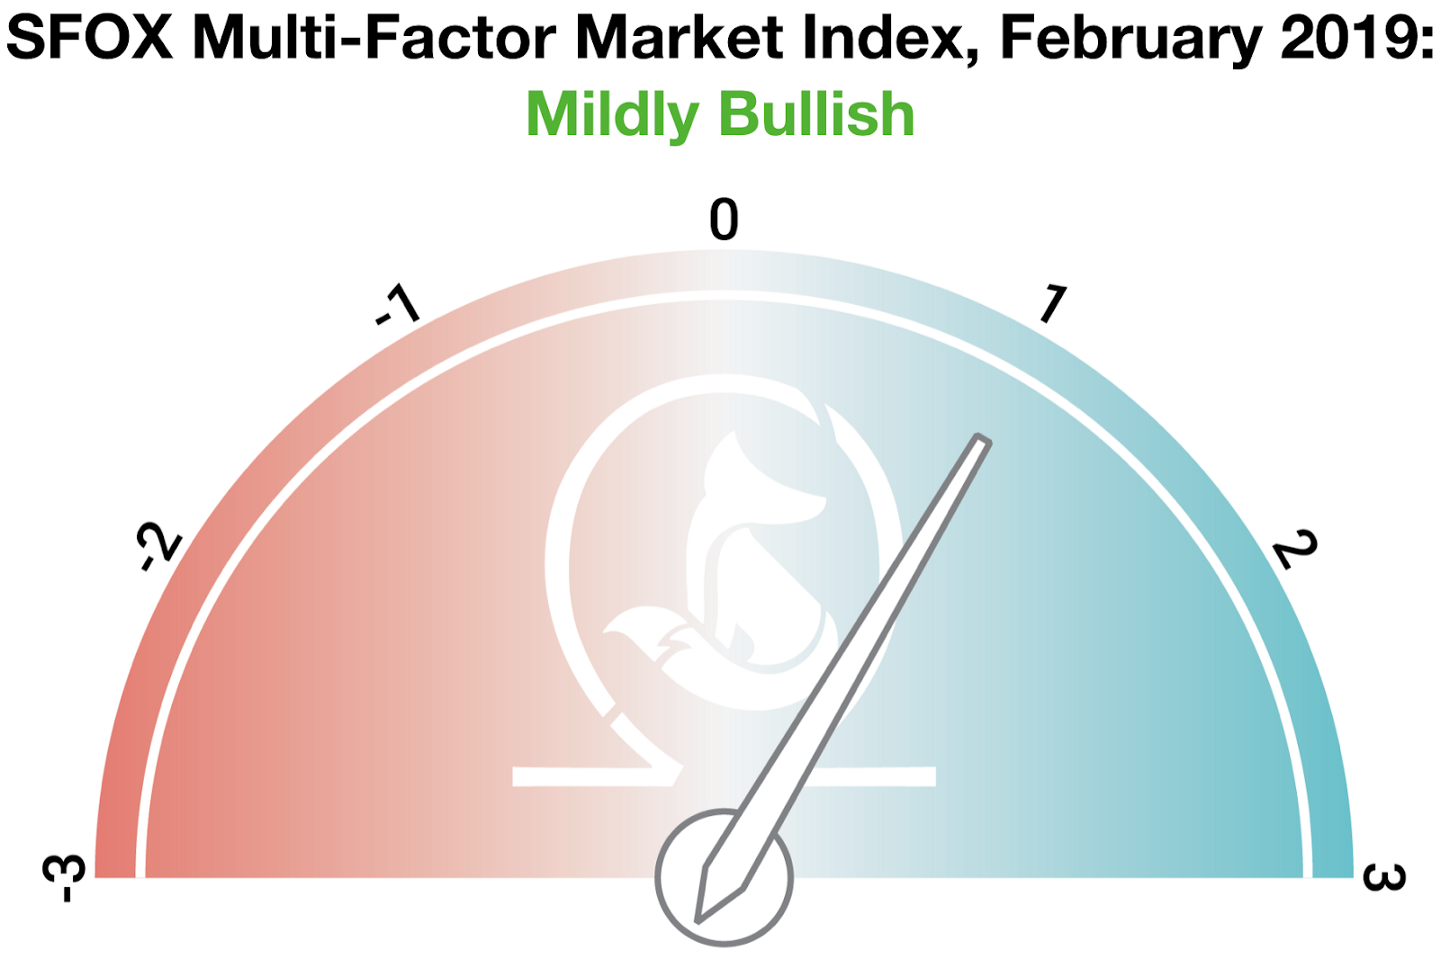
We determine the monthly value of this index by using proprietary, quantifiable indicators to analyze three market factors: price momentum, market sentiment, and continued advancement of the sector. It is calculated using a proprietary formula that combines quantified data on search traffic, blockchain transactions, and moving averages. The index ranges from highly bearish to highly bullish.
Some of the “hype” that we mentioned was absent from the month of January appeared to resurface in February amidst pro-crypto statements from tech personalities (e.g., Elon Musk and Jack Dorsey) and crypto pundits “calling the bottom” of Crypto Winter. However, there were also more fundamental reasons to have a positive outlook on the market: transactions on the Bitcoin network were at the highest level since January 2018. While J.P. Morgan seized the news cycle with the announcement of its own cryptocurrency, institutions of all sizes showed sustained interest in gaining exposure to mainstream cryptocurrencies such as BTC.
Analysis of February 2019 Crypto Volatility
In February of 2019, moments when crypto volatility didn’t rise were as illuminating as moments when it did rise.
Crypto volatility decreased over the Chinese New Year (February 5th) and remained unchanged during J.P. Morgan’s announcement of their own cryptocurrency (February 14th).
That crypto volatility decreased over the Chinese holiday suggests that China may still have a significant impact on the crypto sector as a whole. The fact that cryptocurrencies did not become more volatile when J.P. Morgan announced it would be creating its own proprietary cryptocurrency for payment settlement suggests that traders and investors may be more interested in blockchain use cases that are seen as disruptive of the established financial sector, rather than legacy finance merely adopting blockchain technology in their internal systems.
LTC volatility spiked upon Litecoin Foundation announcing that they are exploring Mimblewimble integration on Litecoin (February 7th-9th).
Mimblewimble is a protocol designed to provide privacy and fungibility to blockchains — features that Charlie Lee specifically told SFOX he valued in an interview last year. The fact that LTC’s volatility spiked at this time suggests that the market is still highly concerned with matters of privacy in crypto transactions: LTC’s price climbed roughly 30% in just hours, suggesting that the market saw increased privacy as a net positive.
Crypto-wide volatility climbed amidst an SEC commissioner expressing optimism about an eventual Bitcoin ETF approval (February 8th-9th).
New regulatory information — even rumors or possibilities — often increases the volatility of the assets under consideration. What’s interesting here is that, even while some factions within the crypto sector question the significance and utility of a Bitcoin ETF, the market still seems to be fairly responsive to news about its potential: in the two days surrounding this news, the price of BTC climbed over 7%.
Crypto-wide volatility rose as prices rebounded amidst a constellation of smaller factors, such as a resurgence in Bitcoin transaction volume and bullish comments on crypto from public figures in tech (February 18th).
A price surge without any singular, clear cause is suspect — and this one didn’t last very long. The clearest positive, longer-term signal for the sector here was a strong upward trend in the number of transactions on the Bitcoin network.
Crypto-wide volatility spiked as prices fell, somewhat inexplicably, near the end of the month (February 25th).
While many were baffled by the crypto market’s stumble here, it’s worth remembering that the rally we mentioned above didn’t seem to have an obvious explanation in the first place — and if the rally itself wasn’t warranted by fundamentals, then this “stumble” is less mysterious.
What to Watch in March 2019
Look to these events as potentially moving the volatility indices of BTC, ETH, BCH, LTC, and ETC in March:
Asia Crypto Week in Hong Kong, March 11th-March 17th.
The inaugural edition of this convention will feature 30+ events bringing together crypto companies, developers, executives, funds, and public figures. As Asian markets play a significant role in crypto, it’s possible that a convention of this magnitude could drive new interest in the space and increase crypto volatility.
CBOE BTC futures expiration on March 13th, BitMEX BTC futures expiration on March 29th, and CME BTC futures last-trade date on March 29th.
Crypto volatility typically moves around the time of futures expirations.
Use the SFOX edge in volatile times through our proprietary algorithms directly from your SFOX account.
The Details: February 2019 Crypto Price, Volatility, and Correlation Data
Price Performance
February saw a modest recovery in crypto prices, with BTC beginning the month at $3418 USD and closing the month at $3818 USD. BTC peaked at $4028 USD on the 23rd, only to retreat south of the $4000 USD mark shortly thereafter.
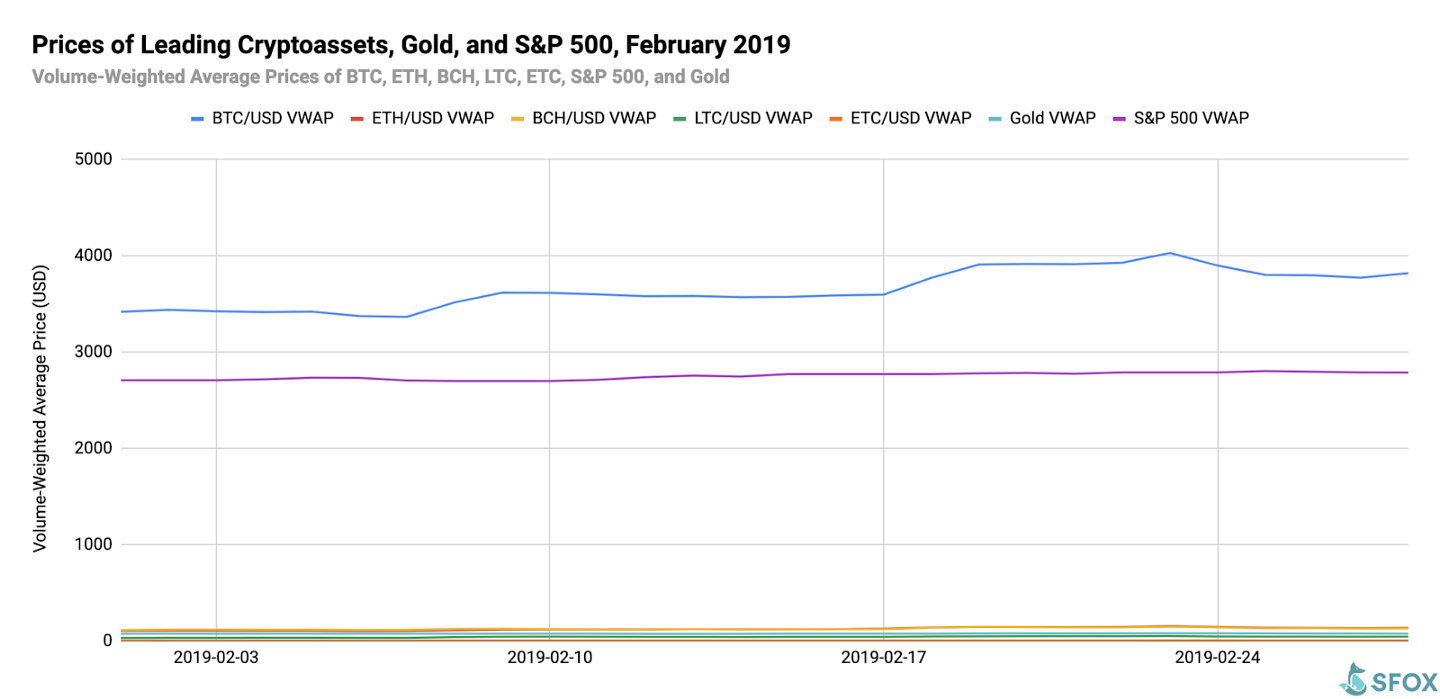
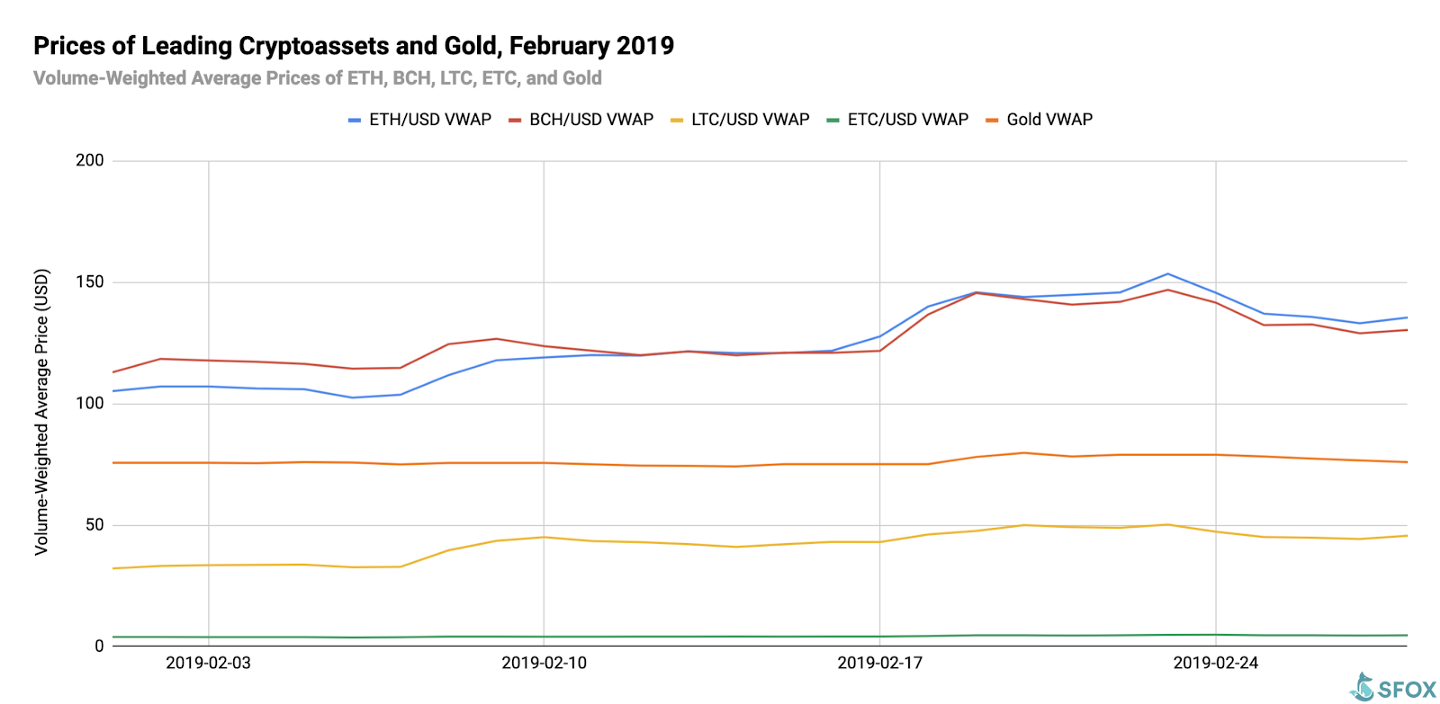
For greater graphical clarity, see this additional chart omitting BTC and the S&P 500 from the data set:
Volatility
By looking at the 30-day historical volatilities of BTC, ETH, BCH, LTC, and ETC, we see that the crypto sector’s volatility spiked at three points in the month: the 8th, the 18th, and the 25th.
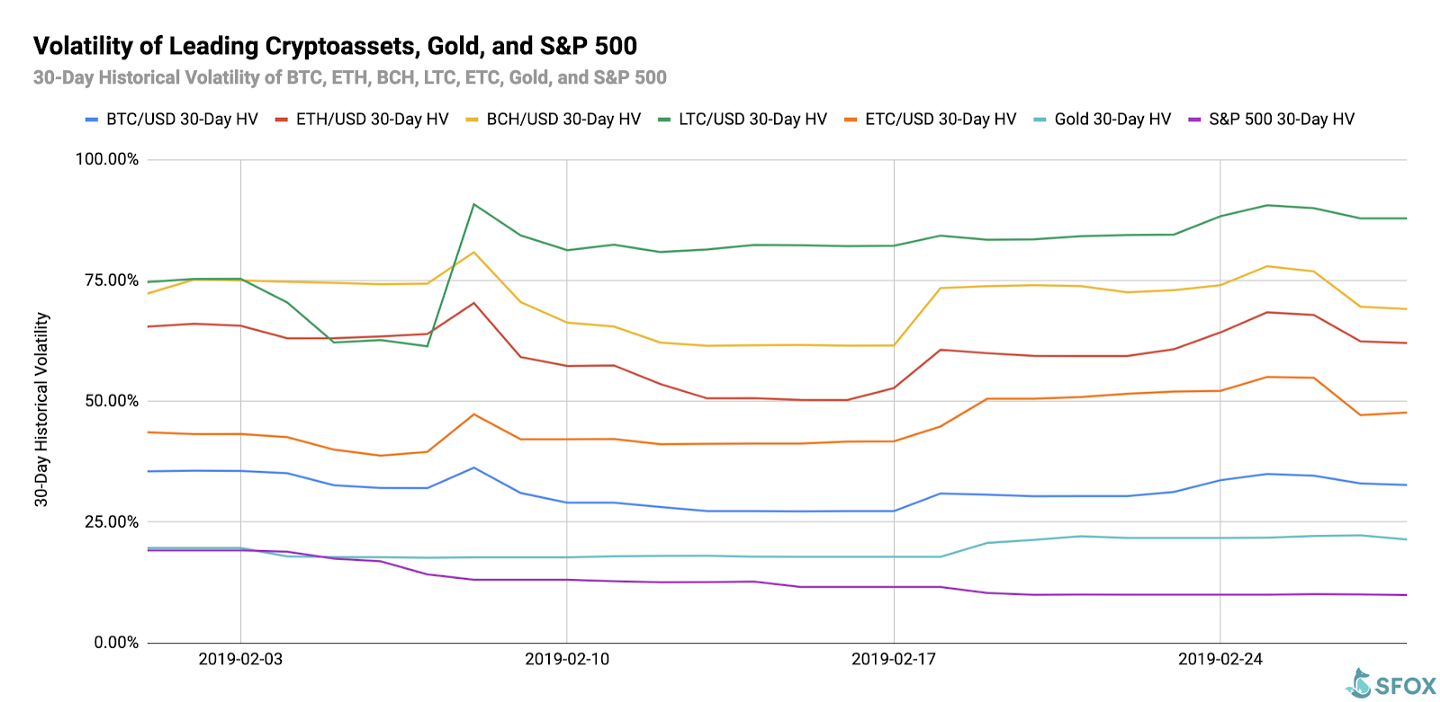
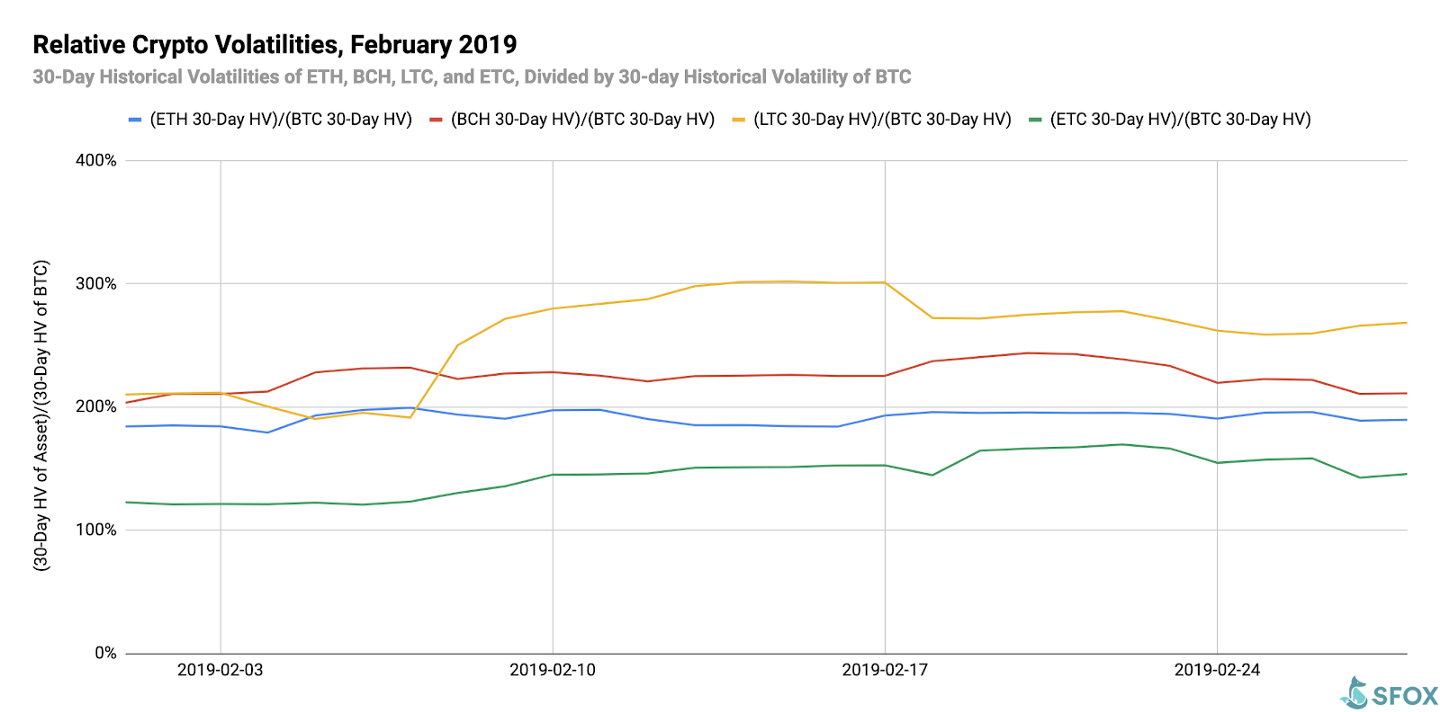
If we look at the 30-day historical volatilities of ETH, BCH, LTC, and ETC as a percentage of BTC’s 30-day historical volatility, we see that ETH, BCH, and ETC’s movements were in line with BTC’s — that’s what the fairly horizontal slope of those lines tell us. In contrast, LTC’s BTC-volatility-relative volatility spiked sharply from the 8th to the 10th, corresponding with the announcement that the Litecoin Foundation is exploring adding Mimblewimble functionality to Litecoin.
Price Correlations
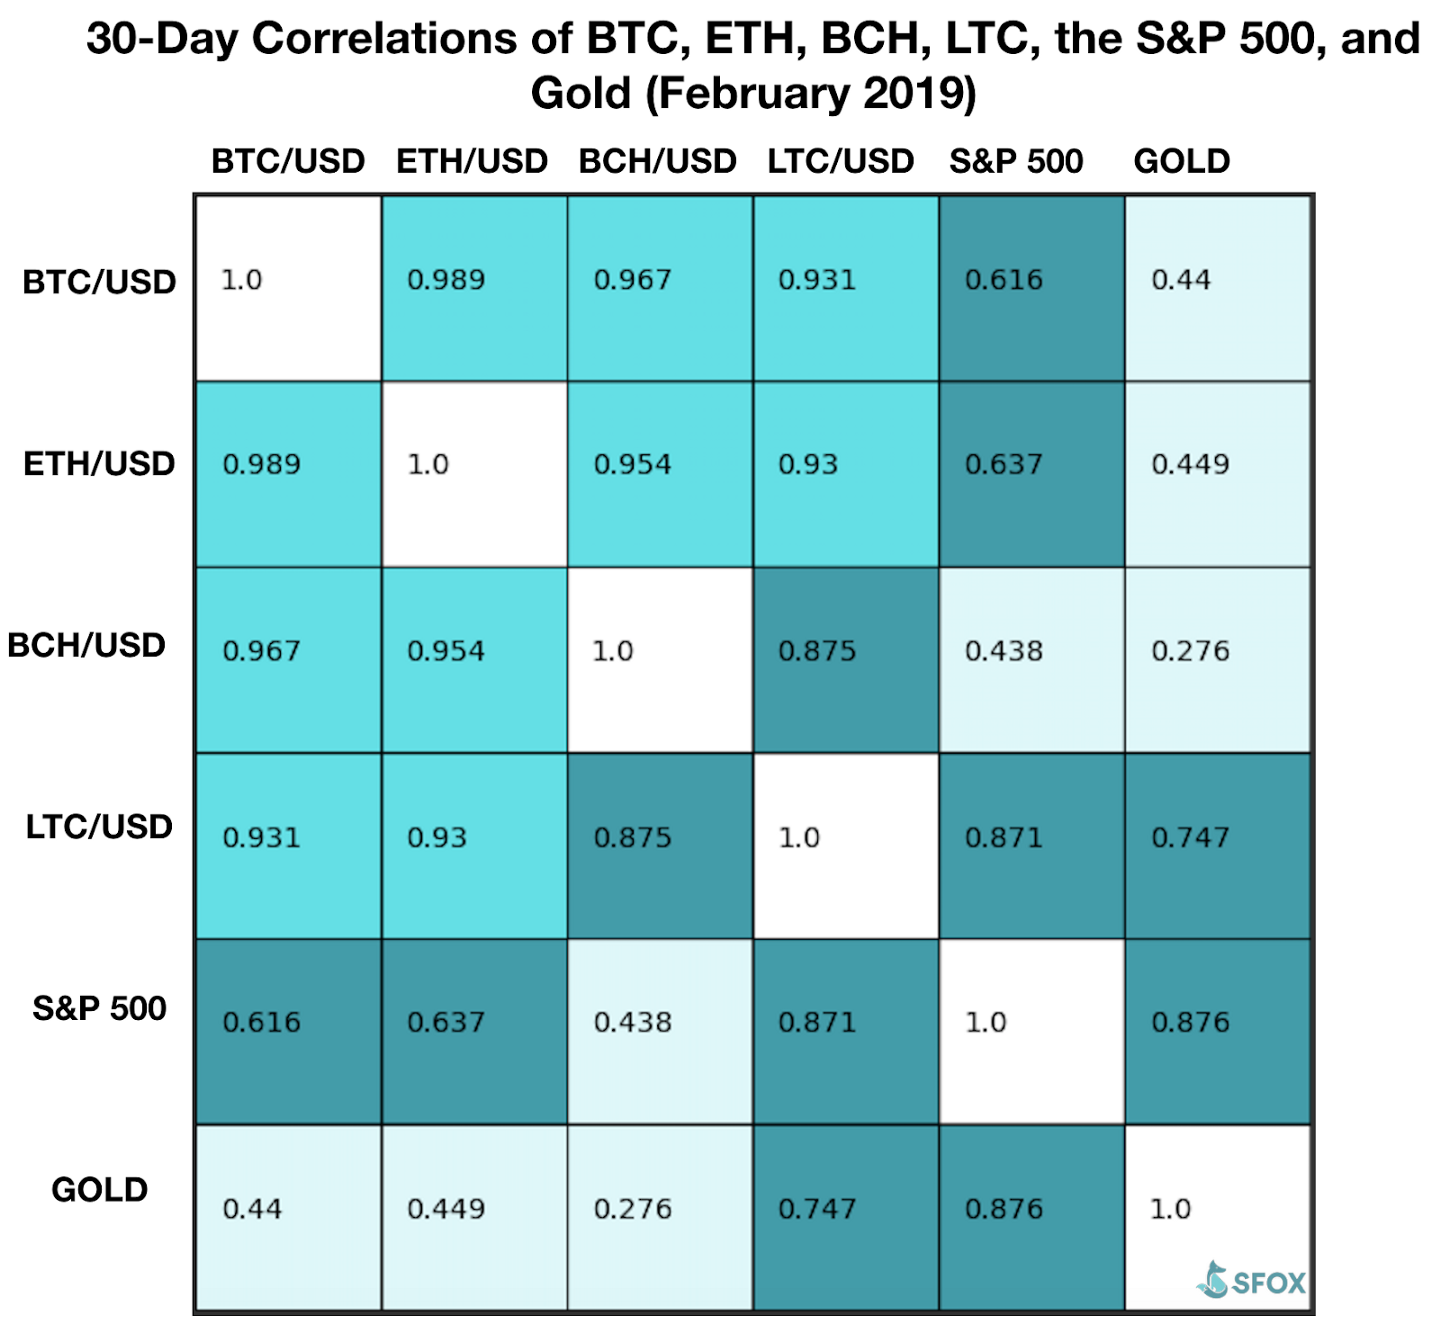
BTC’s 30-day price correlations to ETH, BCH, LTC, and ETC all closed the month as very positive (i.e. close to a value of 1), suggesting that, by the end of February, the crypto sector was largely following BTC’s movements.
For a full crypto correlations matrix, see the following chart:
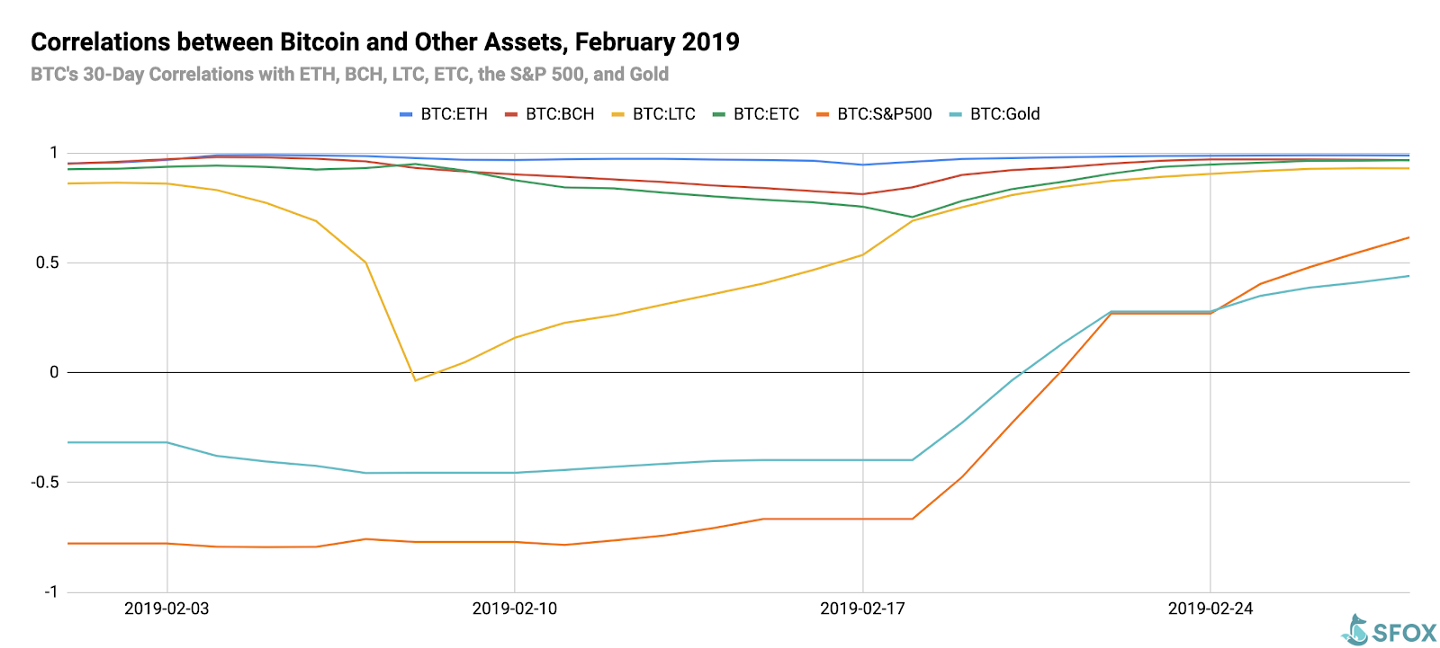
A notable moment in month-long correlations came on February 8th, when LTC, riding the announcement of potential Mimblewimble integration, showed a spike in price that was totally uncorrelated with BTC’s performance.
Appendix: Data Sources, Definitions, and Methodology
We use two different in-house volatility indices in creating these reports:
1. 30-day historical volatility (HV) indices are calculated from daily snapshots over the relevant 30-day period using the formula:
30-Day HV Index = σ(Ln(P1/P0), Ln(P2/P1), …, Ln(P30/P29)) * √(365)
2. Daily historical volatility (HV) indices are calculated from 1440 snapshots over the relevant 24-hour period using the formula:
Daily HV Index = σ(Ln(P1/P0), Ln(P2/P1), …, Ln(P1440/P1439))* √(1440)
S&P 500 performance data are collected from Yahoo! Finance using GSPC (S&P 500 Index) data. Gold performance data are collected from Yahoo! Finance using XAU (Philadelphia Gold and Silver Index) data.
The cryptoasset data sources aggregated for crypto prices, correlations, and volatility indices presented and analyzed in this report are the following eight exchanges, the order-book data of which we collect and store in real time:
- bitFlyer
- Binance
- Bitstamp
- Bittrex
- Coinbase
- Gemini
- itBit
- Kraken
Our indices’ integration of data from multiple top liquidity providers offers a more holistic view of the crypto market’s minute-to-minute movement. There are two problems with looking to any single liquidity provider for marketwide data:
- Different liquidity providers experience widely varying trade volumes. For example: according to CoinMarketCap, Binance saw over $20 billion USD in trading volume in November 2018, whereas Bitstamp saw $2 billion USD in trading volume in that same time — an order-of-magnitude difference. Therefore, treating any single liquidity provider’s data as representative of the overall market is myopic.
- Liquidity providers routinely experience interruptions in data collection. For instance, virtually every exchange undergoes regularly scheduled maintenance at one point or another, at which point their order books are unavailable and they therefore have no market data to collect or report. At best, this can prevent analysts from getting a full picture of market performance; at worst, it can make it virtually impossible to build metrics such as historical volatility indices.
Building volatility indices that collect real-time data from many distinct liquidity providers mitigates both of these problems: collecting and averaging data from different sources prevents any single source from having an outsized impact on our view of the market, and it also allows us to still have data for analysis even if one or two of those sources experience interruptions. We use five redundant data collection mechanisms for each exchange in order to ensure that our data collection will remain uninterrupted even in the event of multiple failures.
Readers should note that we have also enabled the trading of Bitcoin SV (BSV) on SFOX. We are still in the process of collecting sufficient data on BSV to analyze it in accordance with our above standards. Presently, we anticipate that data on BSV will be added to the report next month (the March 2019 edition).
The above references an opinion and is for informational purposes only. It is not intended as and does not constitute investment advice, and is not an offer to buy or sell or a solicitation of an offer to buy or sell any cryptocurrency, security, product, service or investment. Seek a duly licensed professional for investment advice. The information provided here or in any communication containing a link to this site is not intended for distribution to, or use by, any person or entity in any jurisdiction or country where such distribution or use would be contrary to law or regulation or which would subject SFOX, Inc. or its affiliates to any registration requirement within such jurisdiction or country. Neither the information, nor any opinion contained in this site constitutes a solicitation or offer by SFOX, Inc. or its affiliates to buy or sell any cryptocurrencies, securities, futures, options or other financial instruments or provide any investment advice or service.