Summary:
- The SFOX Multi-Factor Market Index remains at mildly bullish entering May 2019.
- April highlighted the sustained influence of BTC and individual exchanges on cryptoasset performance.
- ETH, BCH, and LTC’s movements were highly correlated with BTC, suggesting that large enough movements in BTC may still control the overall market, despite the continued development of other cryptoassets.
- Watch for major industry conferences, Bitcoin ETF decisions, and futures expirations to potentially impact crypto volatility in May 2019.
In the April 2019 edition of our monthly volatility report, the SFOX research team has collected price, volume, and volatility data from eight major exchanges and liquidity providers to analyze the global performance of 6 leading cryptoassets — BTC, ETH, BCH, LTC, BSV, and ETC — all of which are available for algorithmic trading on our trading platform.
The following is a report and analysis of their volatility, price correlations, and further development in the last month. (For more information on data sources and methodology, please consult the appendix at the end of the report.)
Current Crypto Market Outlook: Mildly Bullish
Based on our calculations and analyses, the SFOX Multi-Factor Market Index, which was set at mildly bullish at the end of March 2019, remains at mildly bullish at the end of April, actually edging slightly lower than the value calculated at the end of March.
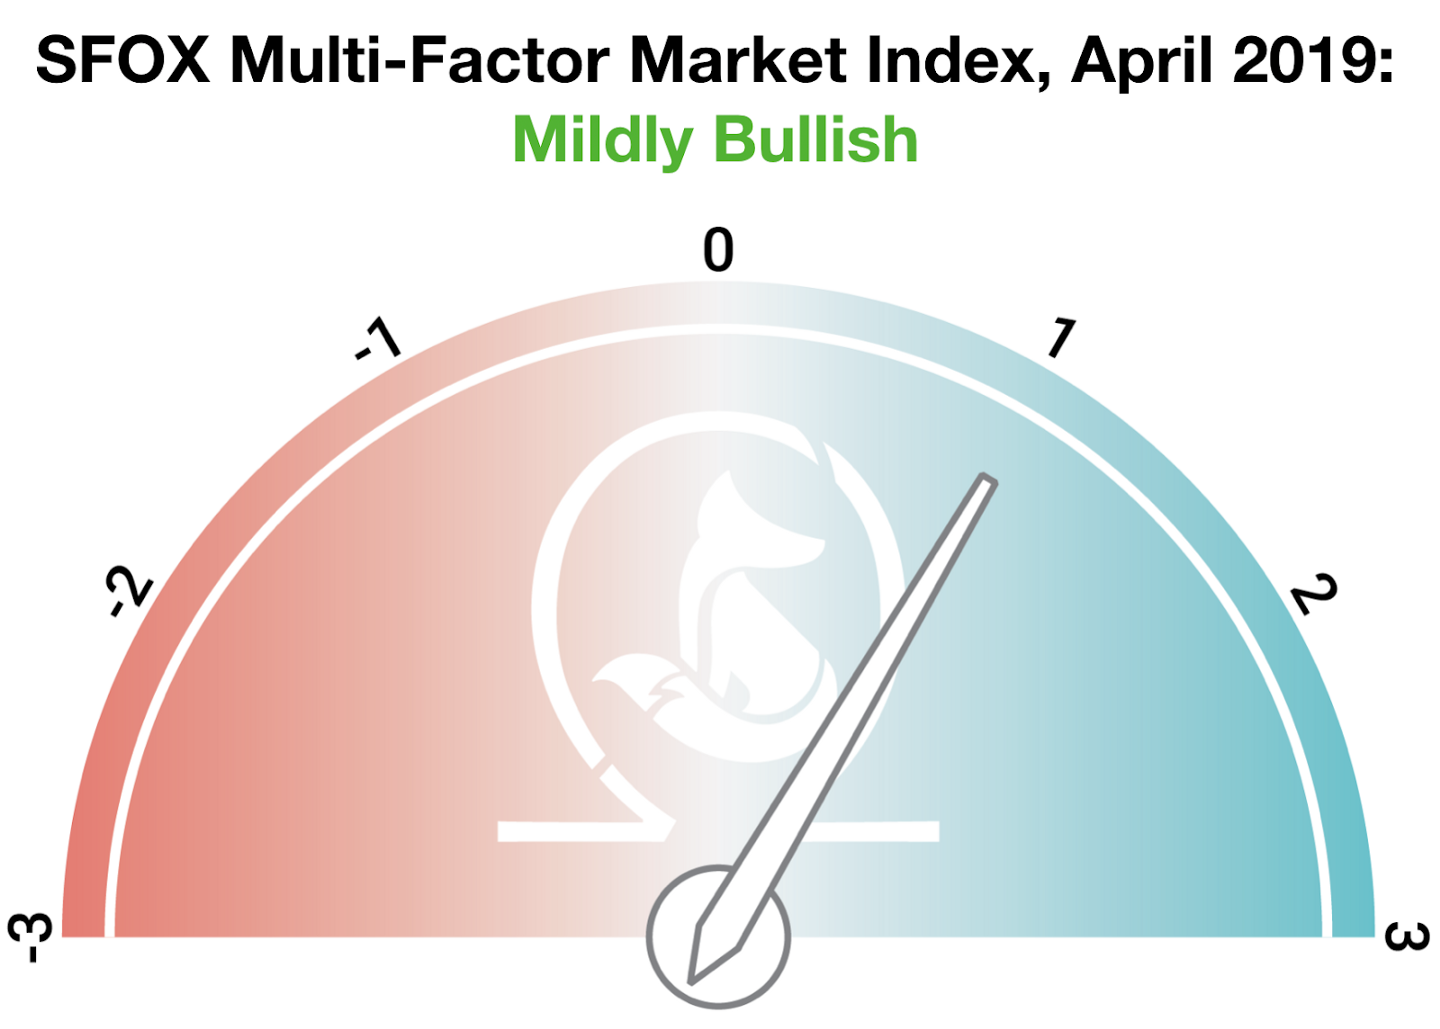
We determine the monthly value of this index by using proprietary, quantifiable indicators to analyze three market factors: price momentum, market sentiment, and continued advancement of the sector. It is calculated using a proprietary formula that combines quantified data on search traffic, blockchain transactions, and moving averages. The index ranges from highly bearish to highly bullish.
Readers might have expected the multi-factor market index to have been upgraded to a more bullish level given the spike in crypto prices at the beginning of April, and it might therefore be surprising that the index remains set to ‘mildly bullish’ for the fourth month in a row. In light of this, it’s worth emphasizing the following two points:
- The fundamentals-driven bullish signals we’ve seen — price momentum, infrastructure development, institutional interest, etc. — have been present for several months.
- The beginning-of-April crypto rally, despite having injected the market with renewed volatility, appears to have primarily been driven by one large buy order rather than fundamentals, and the market appears to have largely normalized again at new levels post-rally.
The signal suggested by this index is positive for the overall sector: while some may worry about market sentiments such as FOMO overwhelming crypto in the wake of an abrupt and unexpected rally, the data interpreted by our index imply that crypto is continuing on a sustained positive trajectory, independent of more transient surges in market interest.
Analysis of April 2019 Crypto Volatility
In April of 2019, BTC reasserted its influence over the collective crypto market by inciting a strong rally in the first few days of the month. Elsewhere, the highs and lows of cryptoassets like ETC and BSV showed the impact that single exchanges can still apparently exert on coin performance. Through it all, we witnessed continued interest of high-profile companies and institutions in further developing the crypto sector.
A sharp, unexpected rise in BTC’s price drove an increase in market cap and volatility in the beginning of the month (April 1st-3rd).
Between April 1st and April 3rd, the price of BTC increased over 20%, from $4122.92 to $5017.13. To the extent that this price surge has an explanation, the prevailing notion is that a 20,000 BTC buy order by an anonymous party on April 2nd threw supply and demand out of equilibrium. This order could possibly have then caused stops to be triggered, creating even more demand and increased buying. Additionally, liquidations of large positions on Bitmex may have added fuel to the fire. This rally was highly publicized in the media, which could have theoretically caused people to experience some FOMO, which drove it even higher — similar to what we observed in late 2017, albeit on a smaller scale. At some point, this cycle ran out of steam, reaching a point at which sellers brought the supply and demand into balance, bringing the most recent price back to a new normalized level between $5000 and $5500, which BTC has only just broken out of in early May. This analysis is consistent with the sustained, higher level of BTC volatility that we’ve seen since its beginning-of-the-month spike.
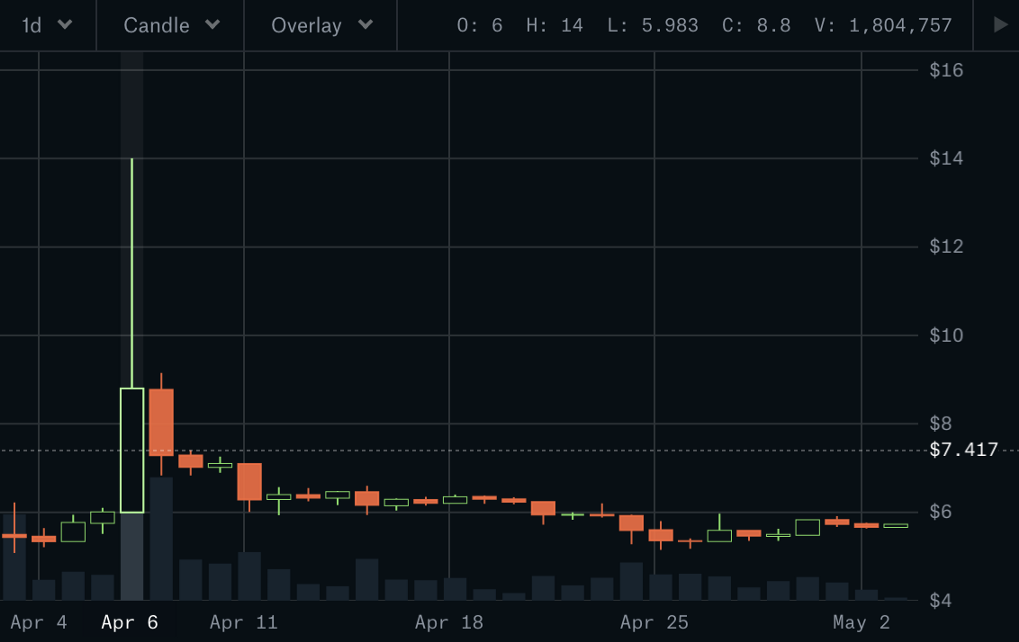
ETC’s dramatic price increase may have pointed to upcoming improvements in its fundamentals — but it also highlighted the impact of singular exchanges on coin performance (April 7th).
On April 7th, the price of ETC climbed over 50%, from $5.84 to $8.91. Whether or not this short-lived spike was motivated by changes in ETC’s fundamentals is unclear. On the one hand, this spike came two days after a public conference call in which the ETC ecosystem discussed its upcoming Atlantis hard fork; while this hard fork isn’t expected until mid-September 2019, its proposed changes are expected to make ETC less manipulable as a network and more DApp-friendly. On the other hand, the data suggest that this price spike mostly came from a single source: reportedly, Coinbase Pro facilitated over 37% of ETC trading volume during this time, and ETC’s price on Coinbase Pro reached as high as $14 at peak — well above the marketwide volume-weighted average price. This extreme discrepancy in ETC’s performance between exchanges invites the question of whether the cryptoasset’s fundamentals were really responsible for its spike in volatility.
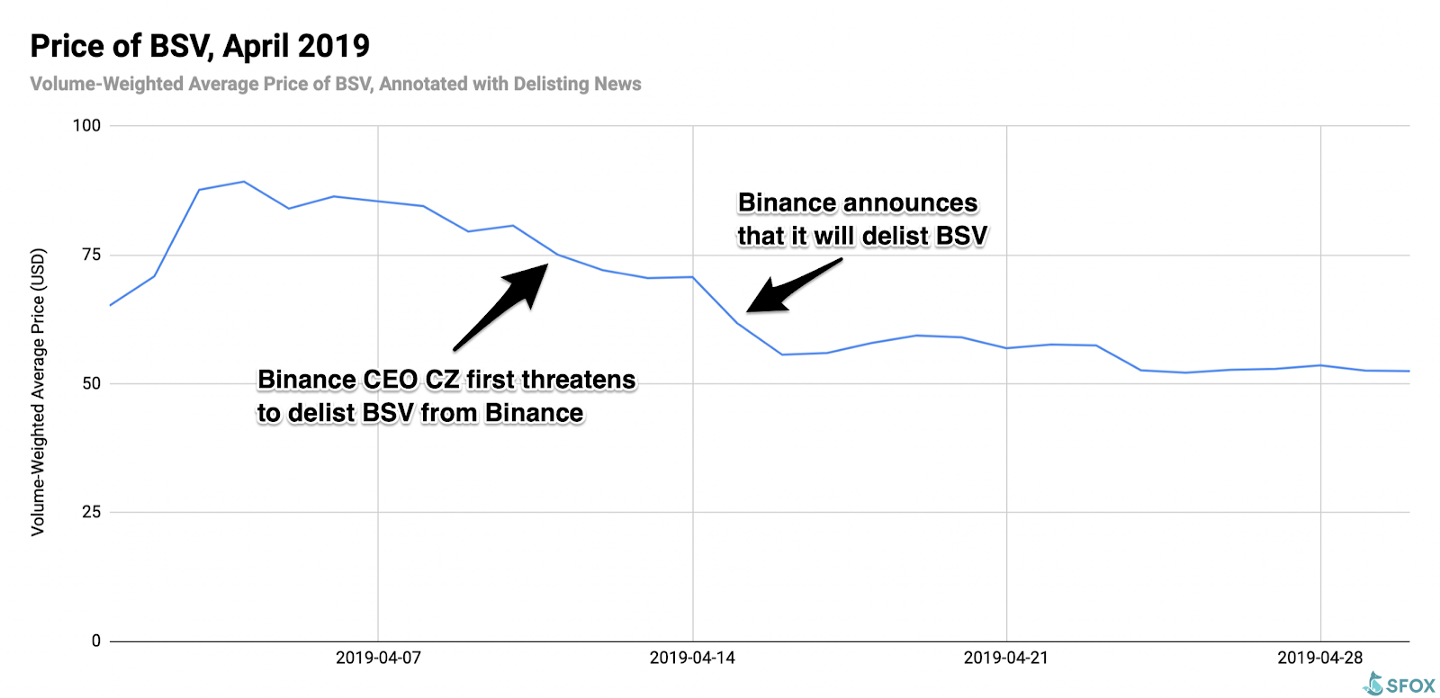
The delisting of BSV from Binance underscored the impact of major exchanges’ listing and delisting decisions on coin performance (April 11th-15th).
BSV made waves this month as Binance (followed by Kraken and ShapeShift) delisted the cryptoasset, in what many believe was a reaction to BSV leader Dr. Craig Wright taking legal action against other members of the crypto community. What’s especially noteworthy here is that BSV’s price and volatility seemed to correlate with delisting rumors and news. Binance CEO CZ first tweeted a threat to delist BSV from Binance on April 11st, and Binance subsequently delisted BSV on April 15th. In that same period, BSV’s price fell over 30%, from $80.68 on April 10th to $55.62 on April 16th. This suggests that listing and delisting assets, especially on major exchanges, may sharply impact their price and volatility.
A report by New York’s attorney general accused crypto exchange Bitfinex of using stablecoin USDT to illicitly cover $850 million in customer withdrawals (April 25th), underscoring the need for market transparency.
Tether’s USDT stablecoin has been controversial in the past when it has been unclear whether each USDT is really 1:1 backed by U.S. dollars. In late April, Tether was again in the news when New York’s attorney general issued a report claiming that Bitfinex borrowed $850 million worth of USDT, backed by a revolving line of credit from Bitfinex, to cover its own shortfalls. Following this news, the volume-weighted average price of BTC fell over 6%, from $5487.31 on April 24th to $5150.79 on April 26th. This report, along with its apparent impact on the market, highlighted the need for increased transparency throughout the market, especially amongst the companies and institutions responsible for major concentrations of funds.
Leading companies and institutions continue to demonstrate real interest and investment in the crypto sector.
While the “hype” around the beginning-of-April rally had somewhat dissipated by the end of the month, announcements came of more major companies exploring crypto projects and integrations, as we discussed with regard to Visa and Facebook in last month’s report. April saw Nike and Jaguar join the ranks of companies exploring crypto: Nike has filed a patent for the word ‘cryptokicks’ and is reportedly working on a cryptoasset-based ecommerce platform, while Jaguar Land Rover is reportedly partnering with IOTA to develop a system allowing car drivers and owners to earn cryptoassets. This reinforces the consistent narrative of institutional interest in crypto, which has persisted independently of “winters” and “rallies.”
What to Watch in May 2019
Look to these events as potentially moving the volatility indices of BTC, ETH, BCH, LTC, BSV, and ETC in May:
Industry-leading crypto conferences in NYC: Fluidity Summit (May 9th), Consensus 2019 (May 13th-15th), and Digital Asset Summit (May 15th).
Within a week of each other, three major conferences will bring together leading names and companies to discuss the future of crypto and blockchain technologies in New York City. Companies and institutions represented across these three conferences include: Goldman Sachs, MetLife, Microsoft, HSBC, PwC, Credit Suisse, Fidelity, Square, the SEC, FedEx, JPMorgan, New York Commodity Exchanges, Comcast Ventures, Point72, Kobre & Kim, Nasdaq, LedgerX, Genesis Trading, and Messari. The concentration of major players discussing crypto in one place in a small period of time, not to mention the potential for any announcements made at these conferences, may potentially impact the market’s volatility.
Bitwise ETF decision (May 16th) and VanEckSolidX Bitcoin ETF decision (May 21st)
The SEC is set to approve or deny two current Bitcoin ETF proposals in the month of May. Historically, the market has been fairly reactive to news about Bitcoin ETF proposals — therefore, the outcomes here could potentially impact crypto volatility.
CME BTC futures last-trade date on May 31st.
Crypto volatility typically moves around the time of futures expirations. With CBOE having backed off from BTC futures for the time being, the date of CME’s futures expiration may potentially impact volatility more than usual.
Get the SFOX edge in volatile times through our proprietary algorithms directly from your SFOX account.
The Details: April 2019 Crypto Price, Volatility, and Correlation Data
Price Performance: A Sharp, Early Rally
April was defined by a sudden, early-month spike in BTC’s price that carried the market upward. Between April 1st and April 3rd, the price of BTC increased over 20%, from $4122.92 to $5017.13. Since April 7th, BTC’s price has found support above the $5,000 mark, mostly oscillating between $5,000 and $5,500, with a peak price of $5,541.45 on April 23rd.
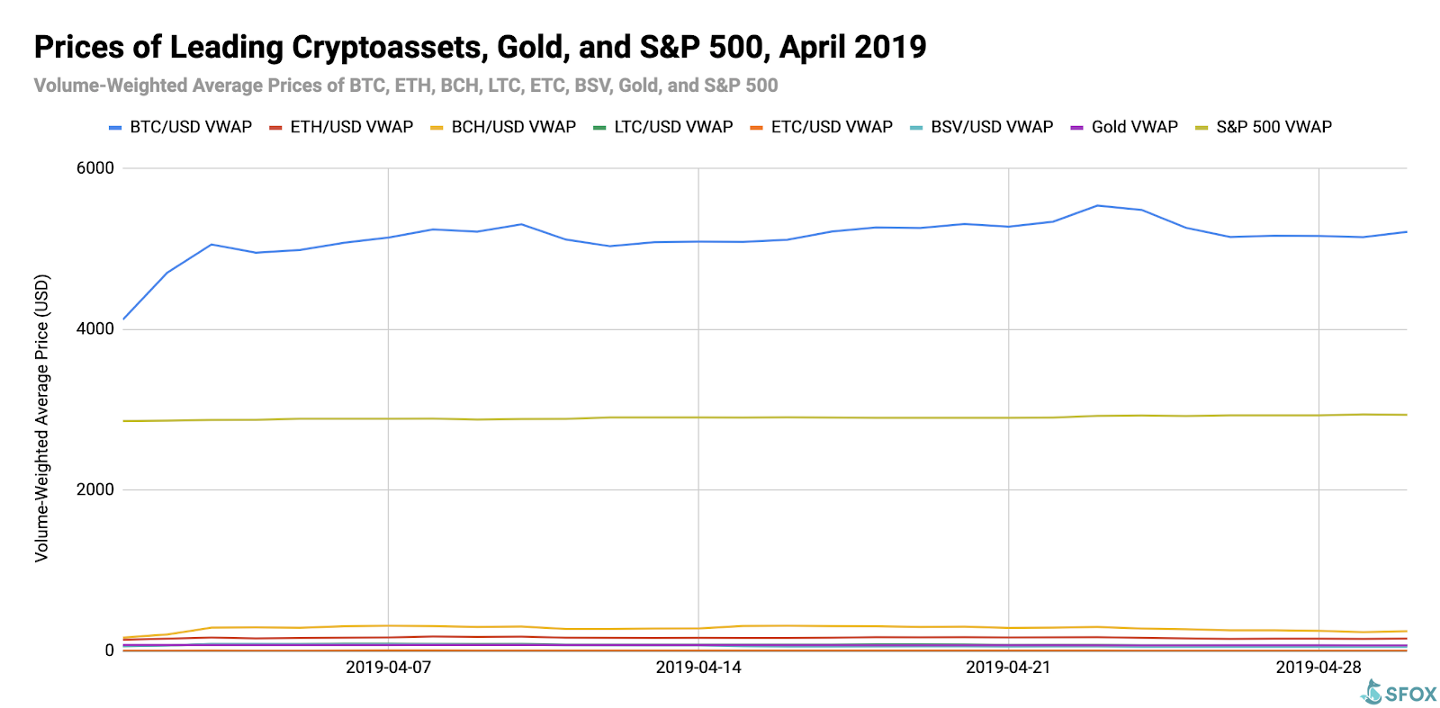
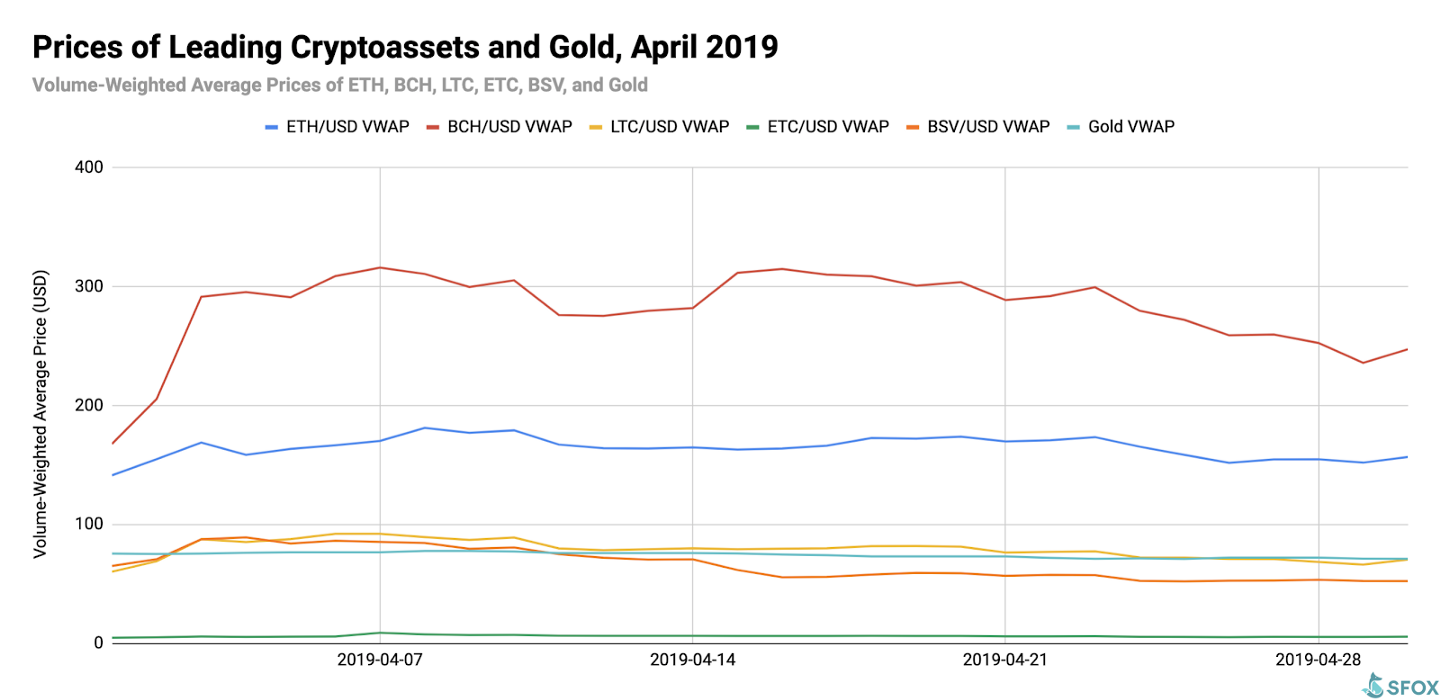
For greater graphical clarity, see this additional chart omitting BTC and the S&P 500 from the data set:
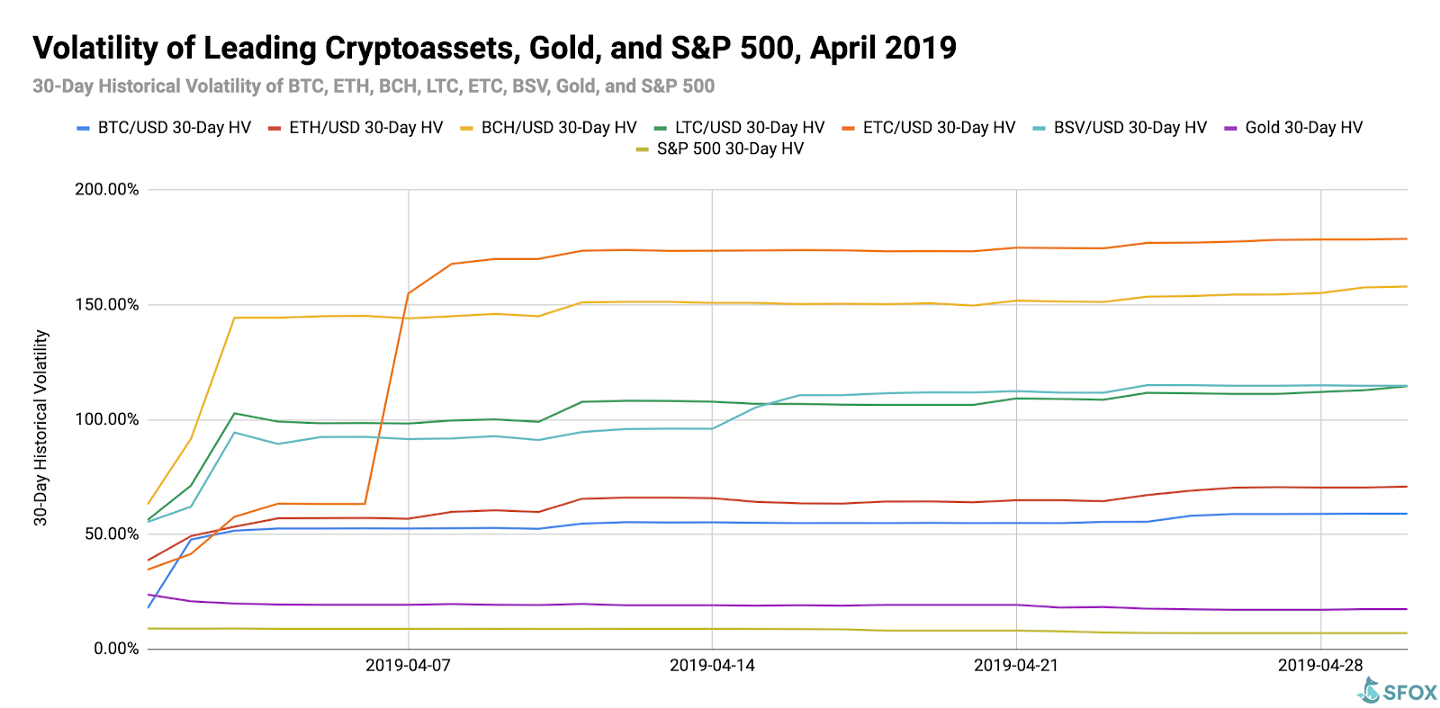
Volatility: New Post-Rally Highs
By looking at the 30-day historical volatilities of BTC, ETH, BCH, LTC, BSV, and ETC, we see that the crypto sector’s volatility categorically spiked during the early-month jump in BTC’s price, reaching new levels that held throughout the month.
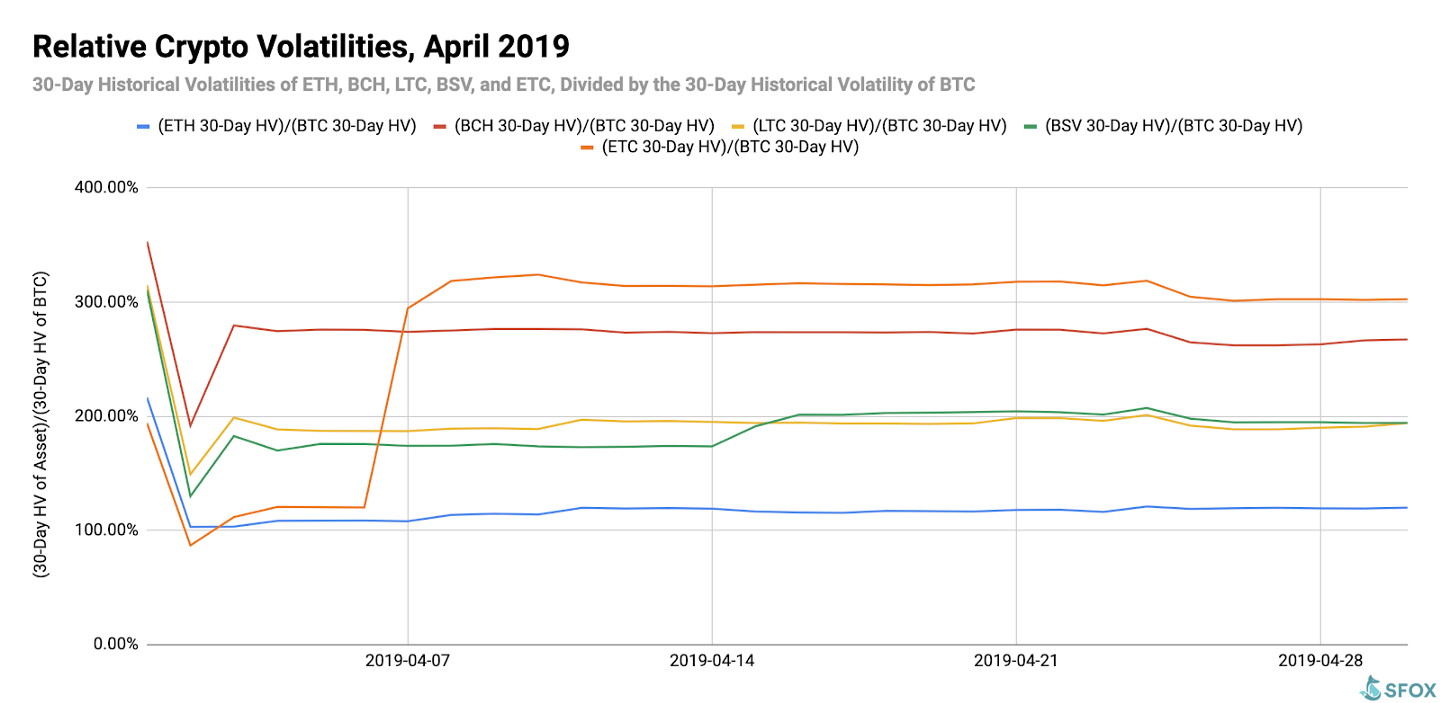
By looking at the 30-day historical volatilities of ETH, BCH, LTC, BSV, and ETC as a percentage of BTC’s 30-day historical volatility, we can see that the increased volatility of the overall market was, by and large, the result of BTC’s increased volatility. The ratios of other cryptoassets’ volatility to BTC’s volatility were driven down across the board at the start of the month, indicating the sharp increase in BTC’s volatility.
After a correction in these volatility ratios on April 3rd, the ratios remained mostly constant throughout the rest of the month. The two notable exceptions to this trend were (1) ETC’s spike in volatility on April 7th (discussed in the analysis above) and (2) BSV’s spike in volatility surrounding its delisting from BSV, Kraken, and ShapeShift.
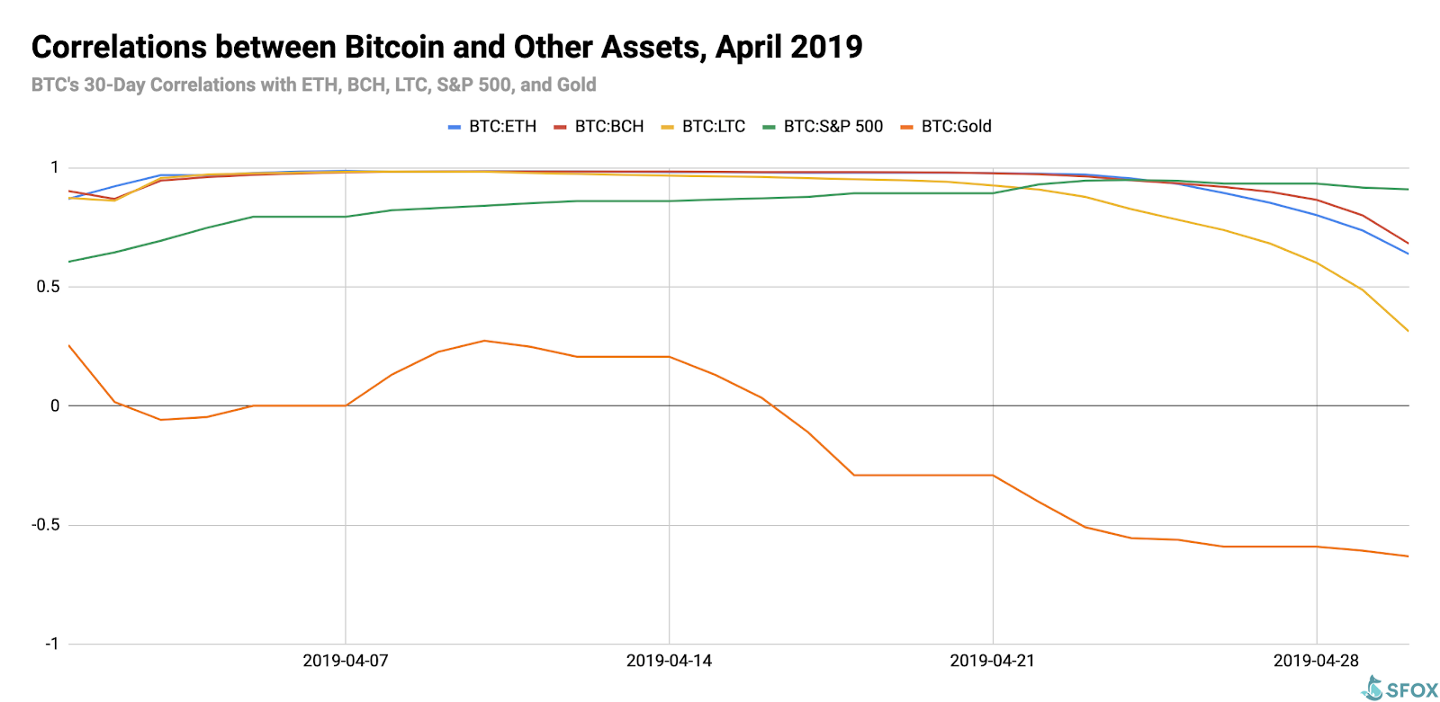
Price Correlations: BTC Reasserting its Dominance — and Correlating Positively with the S&P 500
BTC’s 30-day price correlations to ETH and BCH closed the month as moderately positive (i.e. close to 1). The cryptoasset least correlated to BTC was LTC, with a correlation of 0.314 — a fairly low correlation for a BTC/altcoin pair.
For a full crypto correlations matrix, see the following chart:
For much of the month, ETH, BCH, and LTC were all highly correlated with BTC, suggesting that BTC’s movement was largely driving market activity. Near the end of the month, however, we saw all three of those correlations decrease along with overall trading volume, suggesting that the impact of BTC’s rally on the overall market had tapered somewhat.
It’s also worth noting that, for reasons presently unclear, the S&P 500 was positively correlated with BTC throughout the month. Theoretically, the S&P 500 has no reason to be positively correlated with BTC, so this may be a random occurrence — except insofar as both assets are currently in a risk-on environment.
Appendix: Data Sources, Definitions, and Methodology
We use two different in-house volatility indices in creating these reports:
1. 30-day historical volatility (HV) indices are calculated from daily snapshots over the relevant 30-day period using the formula:
30-Day HV Index = σ(Ln(P1/P0), Ln(P2/P1), …, Ln(P30/P29)) * √(365)
2. Daily historical volatility (HV) indices are calculated from 1440 snapshots over the relevant 24-hour period using the formula:
Daily HV Index = σ(Ln(P1/P0), Ln(P2/P1), …, Ln(P1440/P1439))* √(1440)
S&P 500 performance data are collected from Yahoo! Finance using GSPC (S&P 500 Index) data. Gold performance data are collected from Yahoo! Finance using XAU (Philadelphia Gold and Silver Index) data.
The cryptoasset data sources aggregated for crypto prices, correlations, and volatility indices presented and analyzed in this report are the following eight exchanges, the order-book data of which we collect and store in real time:
- bitFlyer
- Binance
- Bitstamp
- Bittrex
- Coinbase
- Gemini
- itBit
- Kraken
Our indices’ integration of data from multiple top liquidity providers offers a more holistic view of the crypto market’s minute-to-minute movement. There are two problems with looking to any single liquidity provider for marketwide data:
- Different liquidity providers experience widely varying trade volumes. For example: according to CoinMarketCap, Binance saw over $20 billion USD in trading volume in November 2018, whereas Bitstamp saw $2 billion USD in trading volume in that same time — an order-of-magnitude difference. Therefore, treating any single liquidity provider’s data as representative of the overall market is myopic.
- Liquidity providers routinely experience interruptions in data collection. For instance, virtually every exchange undergoes regularly scheduled maintenance at one point or another, at which point their order books are unavailable and they therefore have no market data to collect or report. At best, this can prevent analysts from getting a full picture of market performance; at worst, it can make it virtually impossible to build metrics such as historical volatility indices.
Building volatility indices that collect real-time data from many distinct liquidity providers mitigates both of these problems: collecting and averaging data from different sources prevents any single source from having an outsized impact on our view of the market, and it also allows us to still have data for analysis even if one or two of those sources experience interruptions. We use five redundant data collection mechanisms for each exchange in order to ensure that our data collection will remain uninterrupted even in the event of multiple failures.
The above references an opinion and is for informational purposes only. It is not intended as and does not constitute investment advice, and is not an offer to buy or sell or a solicitation of an offer to buy or sell any cryptocurrency, security, product, service or investment. Seek a duly licensed professional for investment advice. The information provided here or in any communication containing a link to this site is not intended for distribution to, or use by, any person or entity in any jurisdiction or country where such distribution or use would be contrary to law or regulation or which would subject SFOX, Inc. or its affiliates to any registration requirement within such jurisdiction or country. Neither the information, nor any opinion contained in this site constitutes a solicitation or offer by SFOX, Inc. or its affiliates to buy or sell any cryptocurrencies, securities, futures, options or other financial instruments or provide any investment advice or service.