Summary:
- The SFOX Multi-Factor Market Index has moved from neutral to mildly bullish as of September 9th, 2019.
- All leading cryptocurrencies have maintained a low correlation with both the S&P 500 and gold.
- Ethereum Classic was the only major cryptoasset with positive month-over-month returns as of September 9th, 2019.
- Major themes in the crypto sector include continued institutional development and renewed uncertainty about what role crypto will play in global financial markets.
- Watch for ETC’s hard fork, Bakkt’s launch of physically settled BTC futures, and futures expirations to potentially impact crypto volatility in the rest of September.
In the August 2019 edition of our monthly volatility report, the SFOX research team has collected price, volume, and volatility data from eight major exchanges and liquidity providers to analyze the global performance of 6 leading cryptoassets — BTC, ETH, BCH, LTC, BSV, and ETC — all of which are available for algorithmic trading on our trading platform.
The following is a report and analysis of their volatility, price correlations, and further development in the past five weeks. (For more information on data sources and methodology, please consult the appendix at the end of the report.)
Current Crypto Market Outlook: Mildly Bullish
Based on our calculations and analyses, the SFOX Multi-Factor Market Index, which was set at neutral as of August 5th, 2019, has been moved to mildly bullish as of September 9th, 2019.
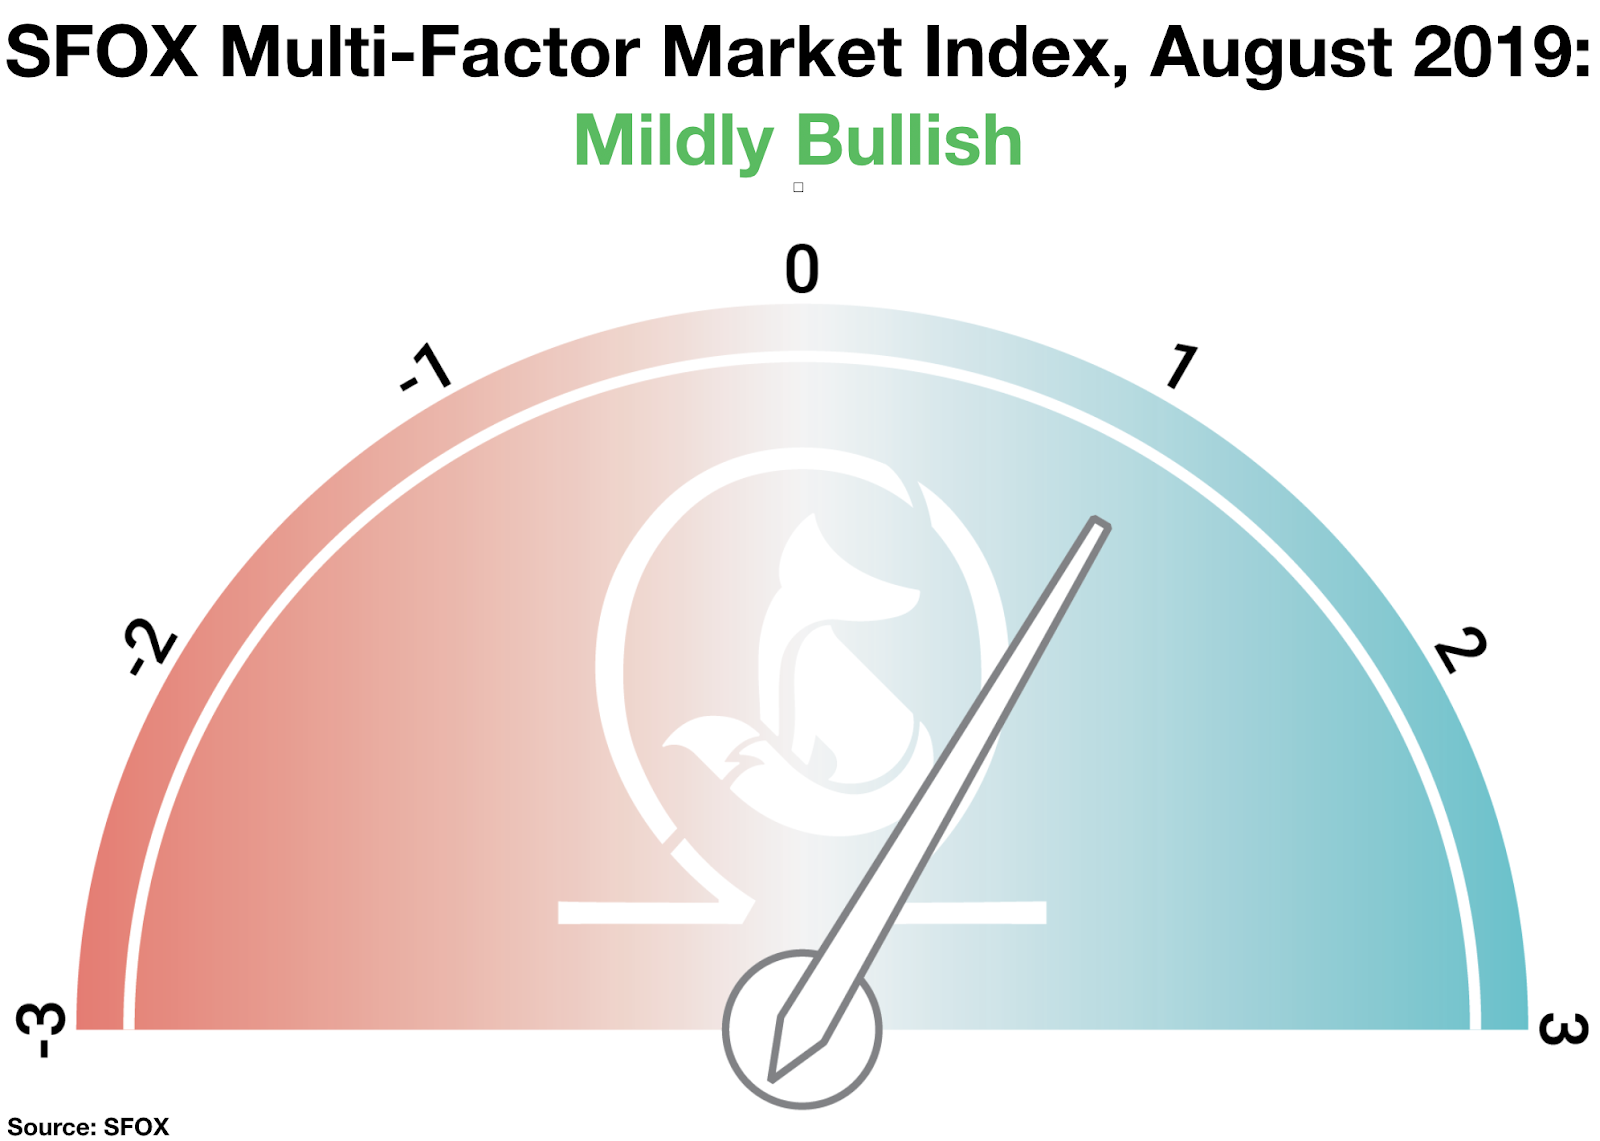
We determine the monthly value of this index by using proprietary, quantifiable indicators to analyze three market factors: price momentum, market sentiment, and continued advancement of the sector. It is calculated using a proprietary formula that combines quantified data on search traffic, blockchain transactions, and moving averages. The index ranges from highly bearish to highly bullish.
It’s worth emphasizing that this month index reading only slightly favors “mildly bullish” over “neutral.” As we consider further in the analysis section below, while BTC and other cryptocurrencies are seeing sustained development and investor interest, there appears to be a new sentimental wave of uncertainty as the market remains unsure of precisely how crypto will fit into the broader global financial landscape of 2020 and beyond.
Analysis of August 2019 Crypto Performance
The last 5 weeks in crypto have seen both continued innovation and renewed uncertainty about exactly how cryptocurrencies and other blockchain technology will play into global financial markets. Read on to better understand where that uncertainty is coming from and what to watch as we get more clarity on key factors in the coming months.
U.S.-China trade concerns have corresponded with more bitcoin movement — but not always in the ways one would expect of “digital gold” (August 5th; August 10th).
The debate over whether or not bitcoin functions as a hedge against global markets has continued amidst concern over global trade, negative interest rates, and the potential for a recession on the horizon. On August 5th, as the yuan fell to its lowest value against the dollar in 11 years, the price of BTC climbed over 7%, from $10851.06 to $11651.75; the price of gold increased 1% over the same timespan. In contrast, the price of BTC fell 4% on August 15th when the U.S. Treasury market flashed an inverted yield curve, even as the price of gold climbed 0.38%. This fluctuation may reflect that crypto remains volatile somewhat independently of global market movements; it may also reflect that investors are simply unsure how much of a “safe haven” BTC is. As David Martin of Blockforce Capital said, one might currently “make an argument” for investors viewing BTC as either a speculative investment or a global hedge.
Major companies are continuing to invest in crypto and blockchain solutions (August 5th; August 8th; August 26th; September 11th).
Even as investors continue to debate BTC’s role in global markets, companies are continuing to invest in crypto and blockchain technologies. On August 5th, news broke of Mastercard posting job listings for a blockchain-based payment solution they’ve just announced that they’re developing with R3. On August 8th, news broke that Allianz Insurance is developing a blockchain-based payment system. On August 26th, Telegram took another step towards driving crypto adoption when Button Wallet giving Telegram users a test network for playing around with the experience of buying and selling crypto without taking on any of the financial risk of trading actual crypto. These appeared to correspond with slight increases in the price of BTC — on August 8th, BTC’s price was up 4 bps, and on August 26th, it was up 2.9% — but it’s not clear whether or how much news of continued development is really driving the market, especially when these offerings are still in developmental stages.
Ethereum Classic was the only cryptoasset with positive month-over-month returns as of September 9th.
As of September 9th, ethereum classic (ETC) reported 12.54% month-over-month returns. ETC was also noteworthy this past month for gaining 16.8% on August 22nd alone, during which time its returns became much less correlated with those of BTC and the rest of the crypto market.

It’s not totally clear what’s led to ETC’s uncorrelated returns, but notable hypotheses include (1) ETC’s upcoming Atlantis hard fork, aimed at improving ETC security, privacy, and ease of cross-chain collaboration, and (2) Ethereum Classic Labs’ partnership with North Block Capital, aimed at providing support for token sales and expansion into Asian markets.
If you’re looking to capture best trade execution on smaller-market-cap coins like ETC and avoid moving the market with your trades, consider using SFOX to algorithmically buy and sell ETC across all major exchanges from a single account.
Market sentiment indices, major fund movements, and founder commentary reflect a general sentiment of market uncertainty (August 17th; August 19th; September 5th).
On August 17th, alternative.me’s Crypto Greed and Fear Index dropped to a 244-day low of “extreme fear,” despite BTC posting 0.61% returns that day. Two days later, Ethereum founder Vitalik Buterin made waves when he was quoted as saying that “the Ethereum blockchain is almost full” and that this is driving up transaction fees. While this problem may be addressed by Ethereum 2.0, the price of ETH saw a gradual decline after this comment — down 9% from $199.15 on August 19th to $180.83 on September 9th. And on September 5th, someone moved over $1 billion of BTC from one wallet to another in a transaction that the market can only theorize about. These factors collectively paint a picture of a crypto sector that, despite having matured much in the last few years, still has many unsure about its precise role in the future.
Bakkt started accepting deposits in advance of the launch of its futures platform and the CME is reportedly preparing to launch BTC options trading (September 6th).
Bakkt has begun accepting deposits ahead of its platform’s official launch on September 23rd, which will bring physically settled BTC futures contracts to market. The CME is also reportedly readying the launch of BTC options, adding a new crypto derivatives product on top of its BTC futures contracts. This marks the latest step in the continued development of more sophisticated, institution-grade trading instruments in the crypto market.
What to Watch in the Rest of September 2019
Look to these events as potentially impacting the volatility of BTC, ETH, BCH, LTC, BSV, and ETC in the remainder of September 2019:
ETC’s Atlantis Hard Fork (September 13th).
Ethereum Classic’s hard fork is expected to take place in a matter of hours. If expectations surrounding the fork were a factor in its price movements over the past month, then the activation of the fork could hypothetically impact its price as well.
Bakkt futures launch (September 23rd).
The much-anticipated physically settled BTC futures market is set to launch on Bakkt later this month. This new tool for crypto trading, especially given its target market of institutional/sophisticated investors, may hypothetically correspond to movements in the broader crypto market.
CME BTC futures last-trade date and BitMEX futures last-trade date (September 27th).
Crypto volatility typically moves around the time of futures expirations. As this is the expiration date for quarterly BTC futures contracts, there may be more general interest in them than typical futures expirations, especially as the expiration date nears.
Get the SFOX edge in volatile times through our proprietary algorithms directly from your SFOX account.
The Details: August 2019 Crypto Price, Volatility, and Correlation Data
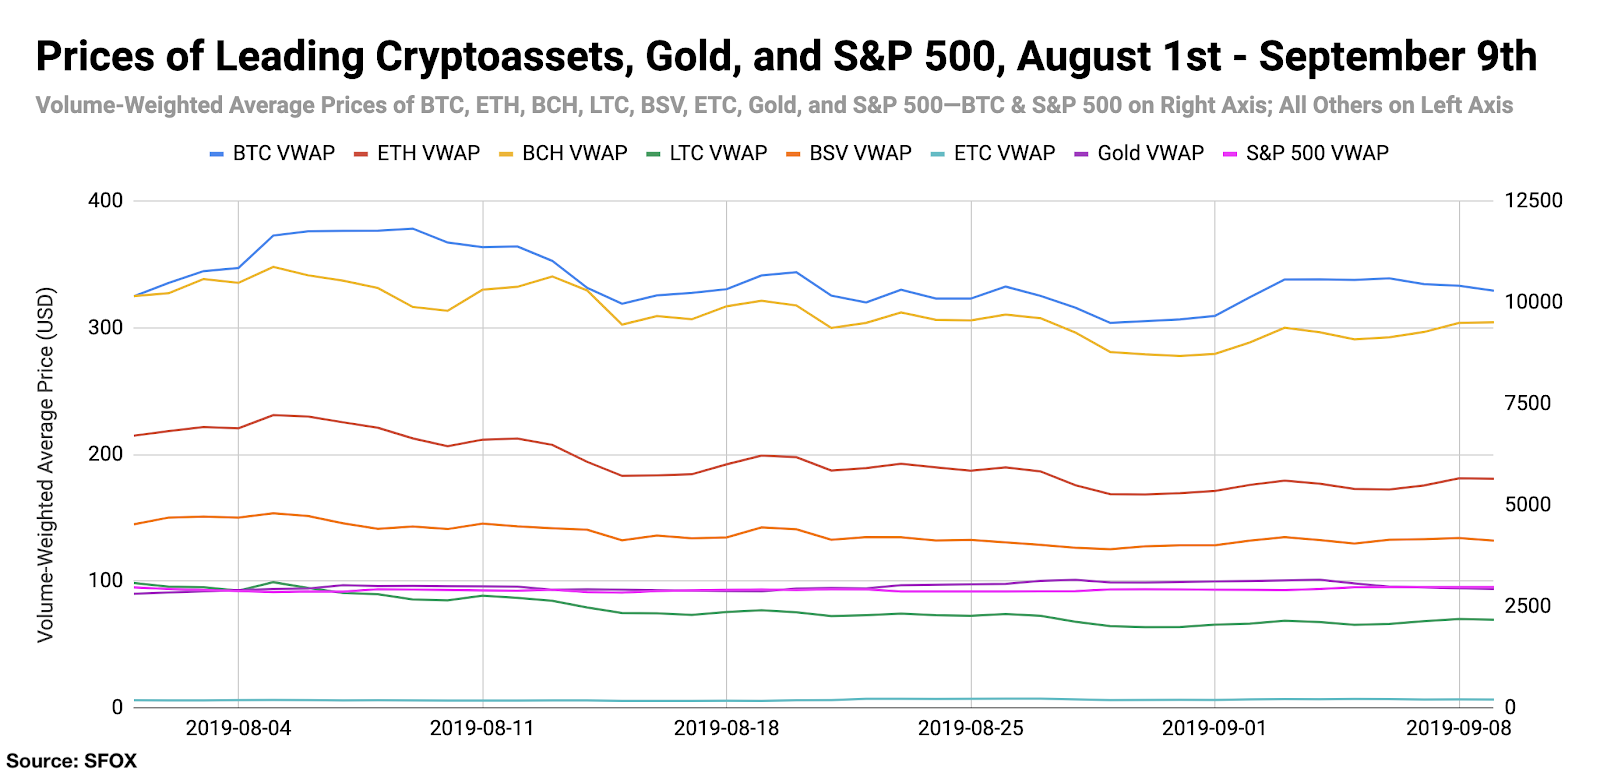
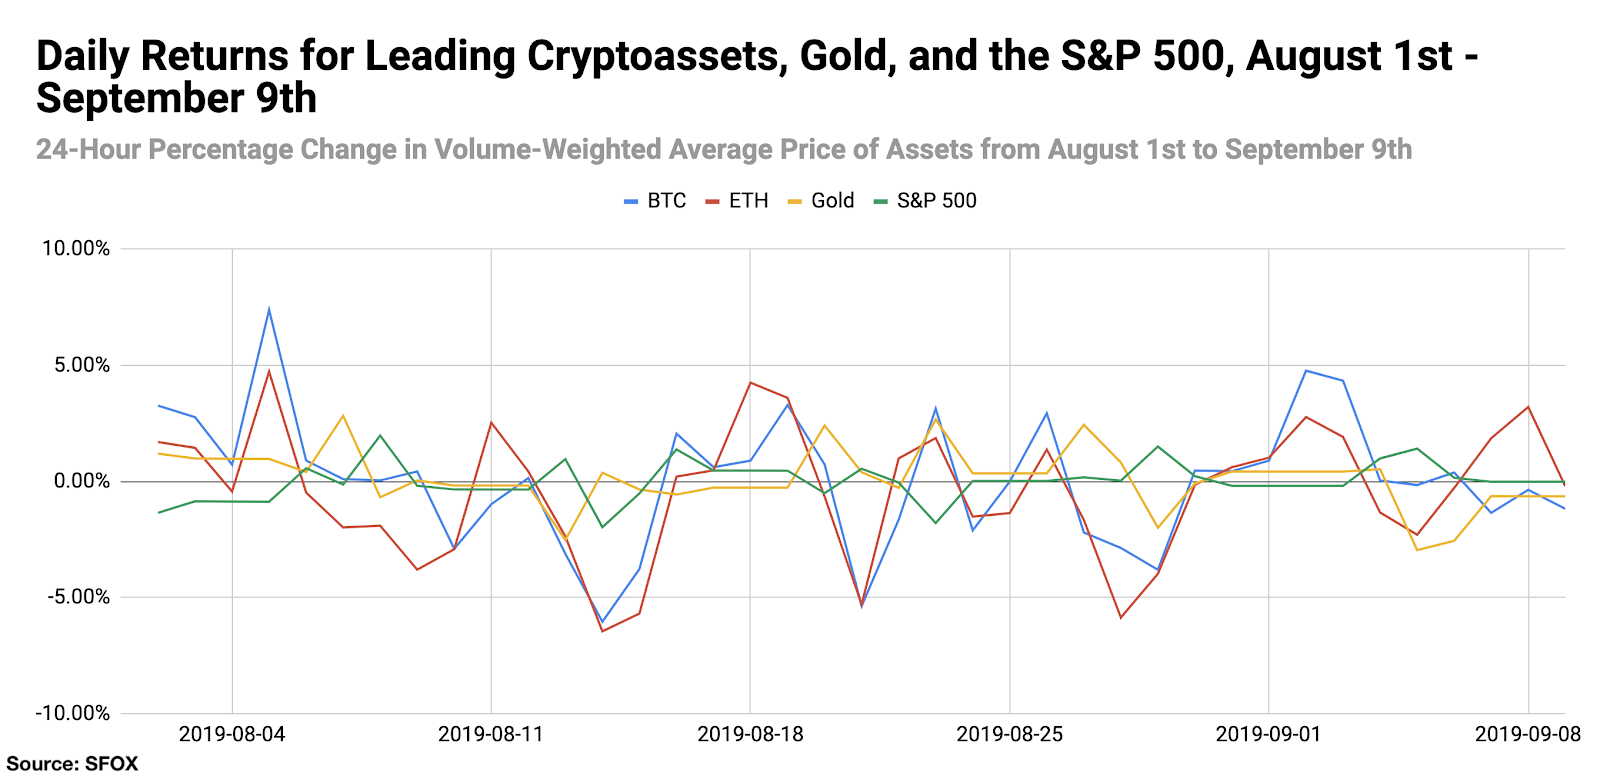
Price Performance: Broad Fluctuations
The price to buy bitcoin has ranged over $2300 — roughly 23% of its current price at the time of writing — in the past month, peaking at a price of $11822.69 on August 9th and bottoming out at a price of $9496.79 on August 29th.
As we noted in our analysis above, the outlier in terms of daily returns was ethereum classic, which saw multiple spikes the week of August 18th, increasing over 25% in price over just three days.
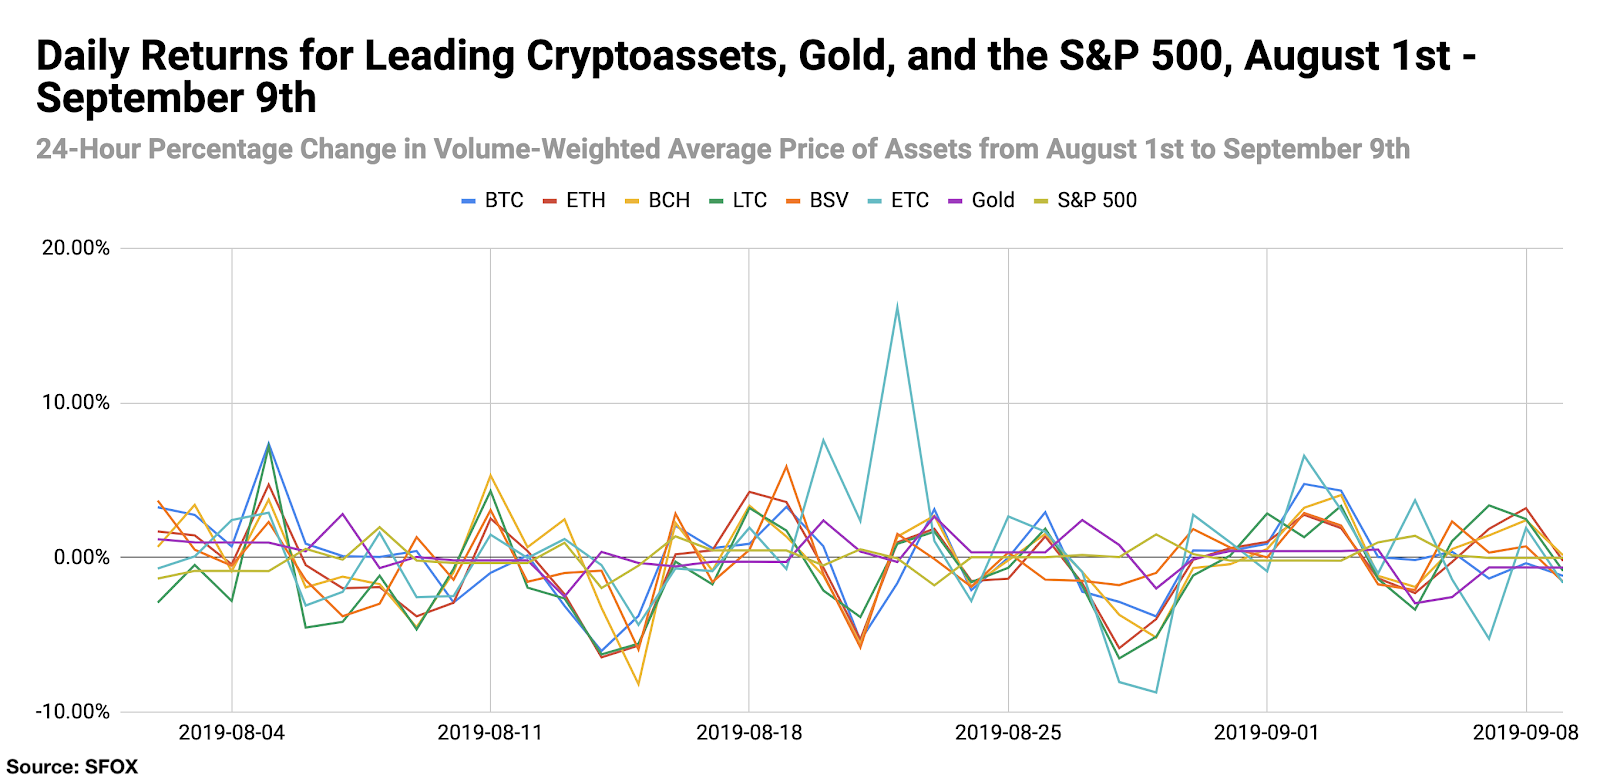
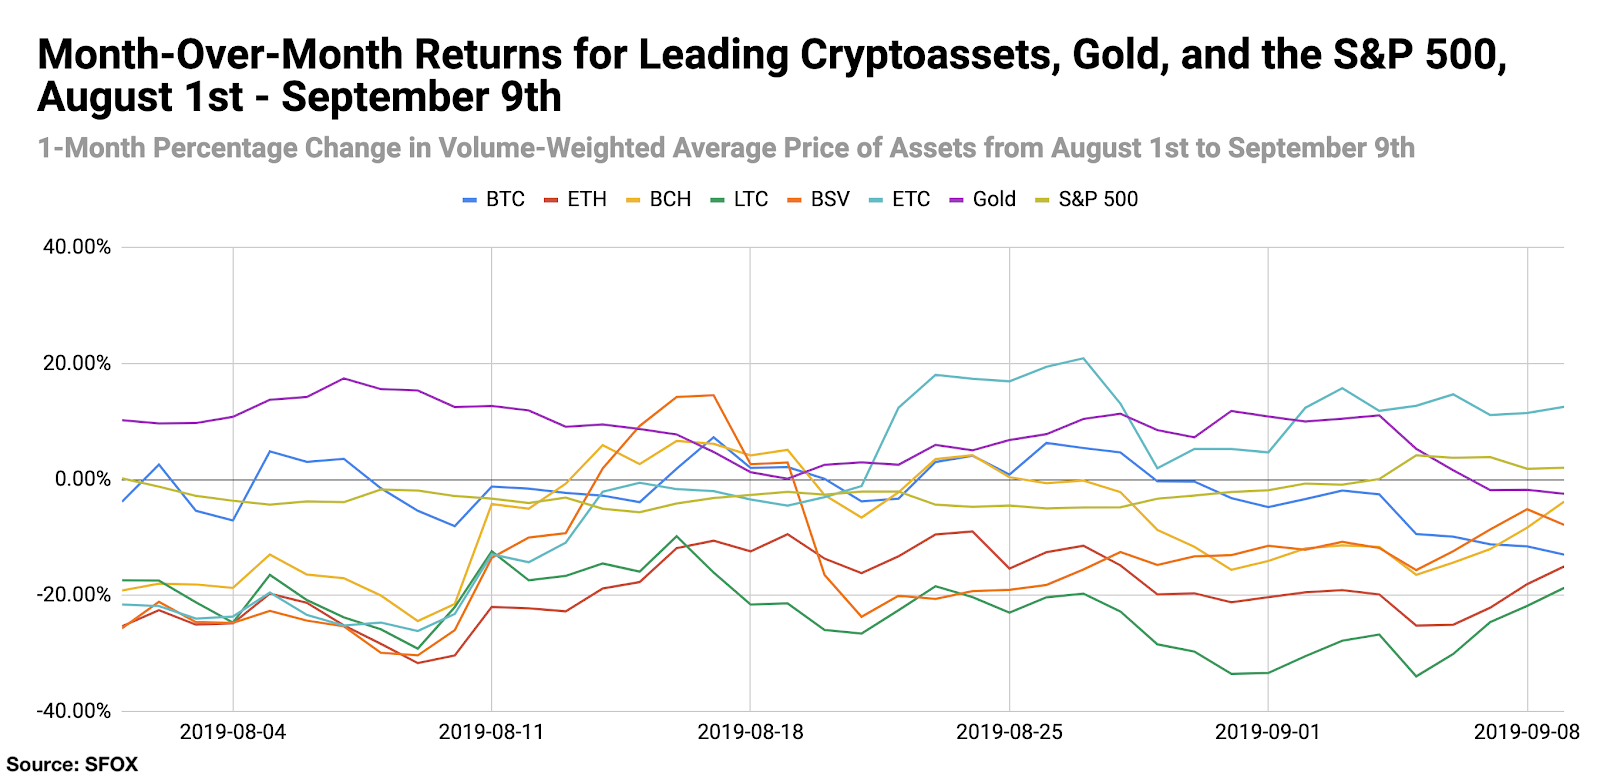
As of September 9th, ethereum classic (ETC) led all assets tracked by our report in month-over-month growth at 12.54%. The S&P 500 followed with 2.02% month-over-month growth. All other tracked assets reported month-over-month losses on September 9th, with litecoin (LTC) having the severest month-over-month losses at -18.69%.
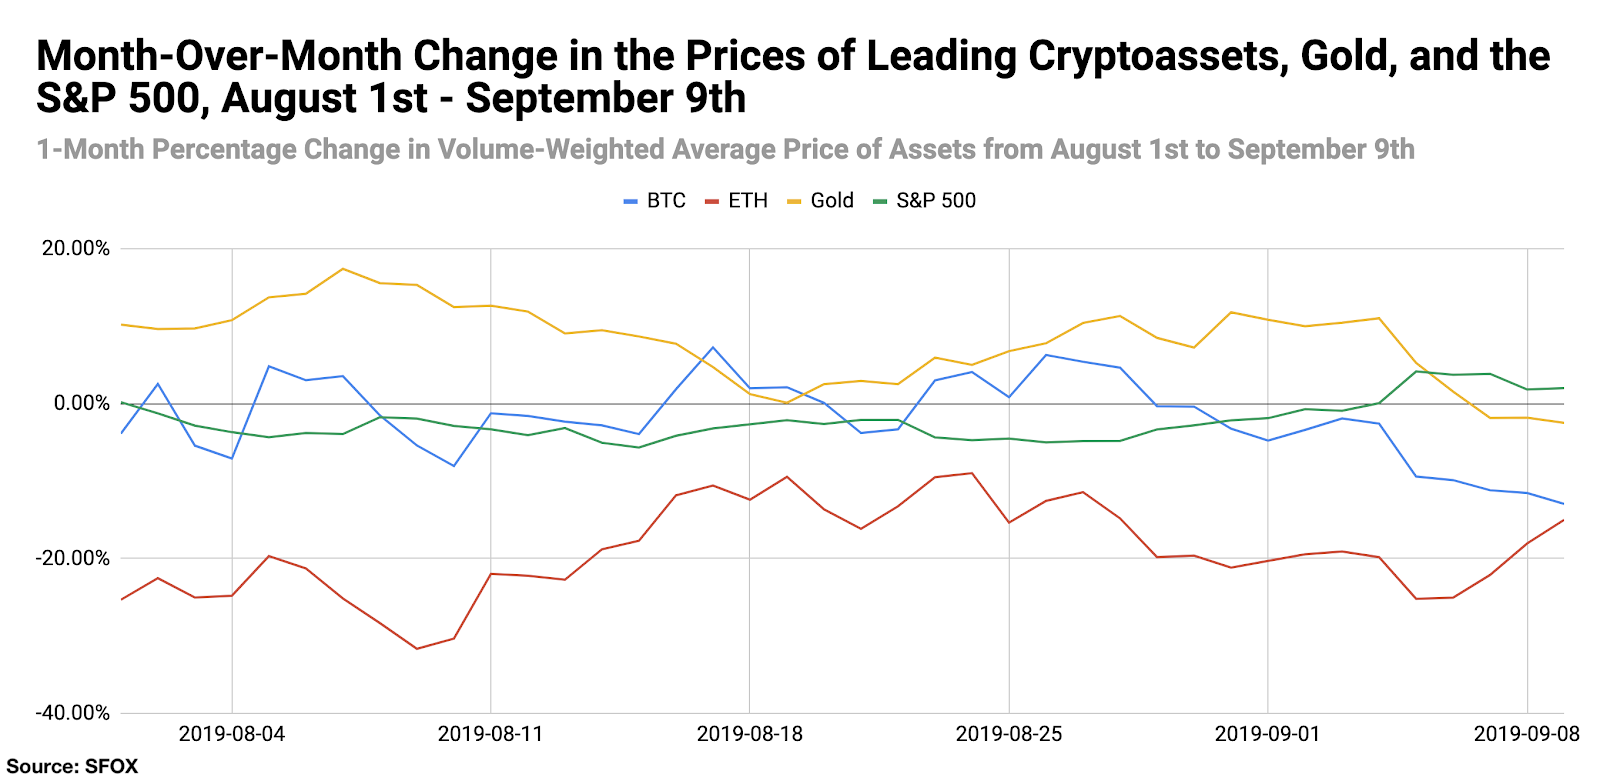
For greater graphical clarity, see this additional chart tracking only the month-over-month changes in the prices of BTC, ETH, gold, and the S&P 500:
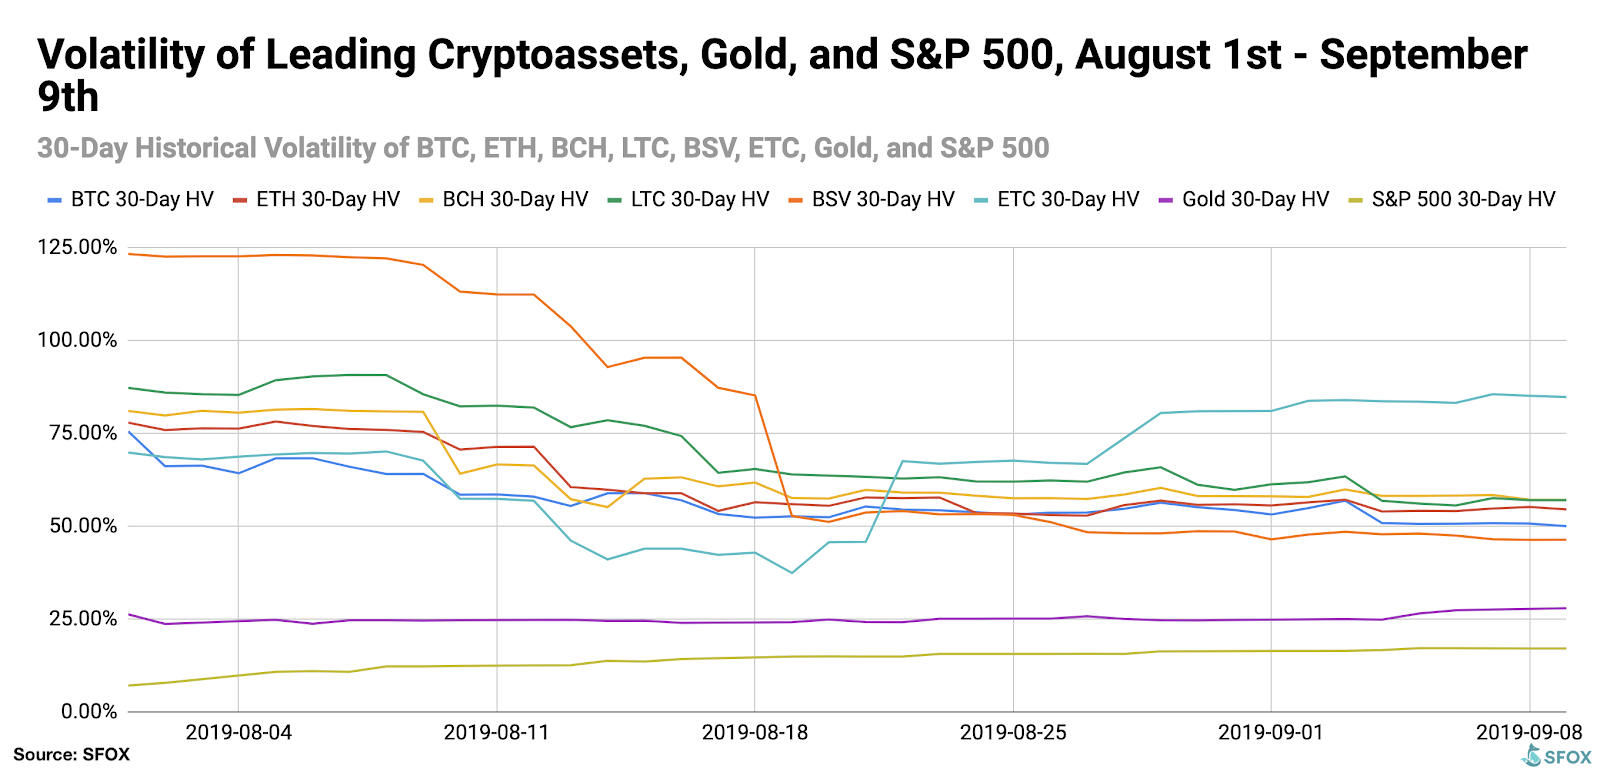
Volatility: (Mostly) Gradual Decline
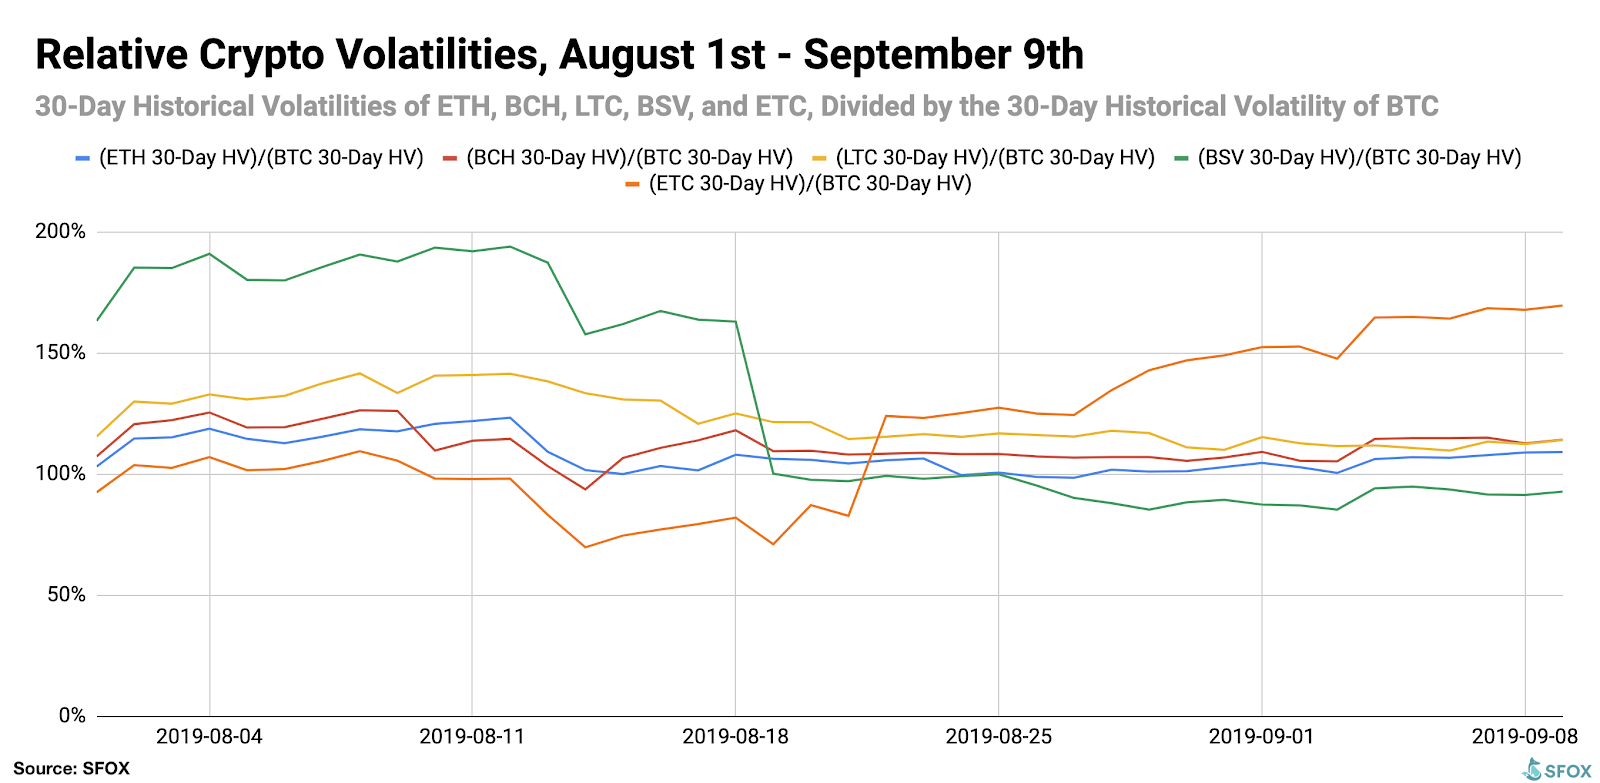
By looking at the 30-day historical volatilities of BTC, ETH, BCH, LTC, BSV, and ETC, we see that the volatility of most major cryptoassets gradually declined throughout the last five weeks. As we discussed above, the exception has been ethereum classic (ETC), which has climbed from a trough of 37.41% on August 19th to a high of 85.57% on September 7th.
By looking at the 30-day historical volatilities of ETH, BCH, LTC, BSV, and ETC as a percentage of BTC’s 30-day historical volatility, we can see more clearly that most altcoin volatility was following BTC’s volatility, with the exception of ETC.
Price Correlations: Meditations on Diversification
The most recent crypto correlations data show all leading cryptocurrencies have a slight negative correlation with the S&P 500. Altcoins were positively correlated with BTC, though it bears emphasizing that ethereum classic (ETC) was much less correlated with other cryptoassets than typical — its highest correlation with another crypoasset has a 0.4 correlation with bitcoin cash (BCH).
For a full crypto correlations matrix, see the following chart:
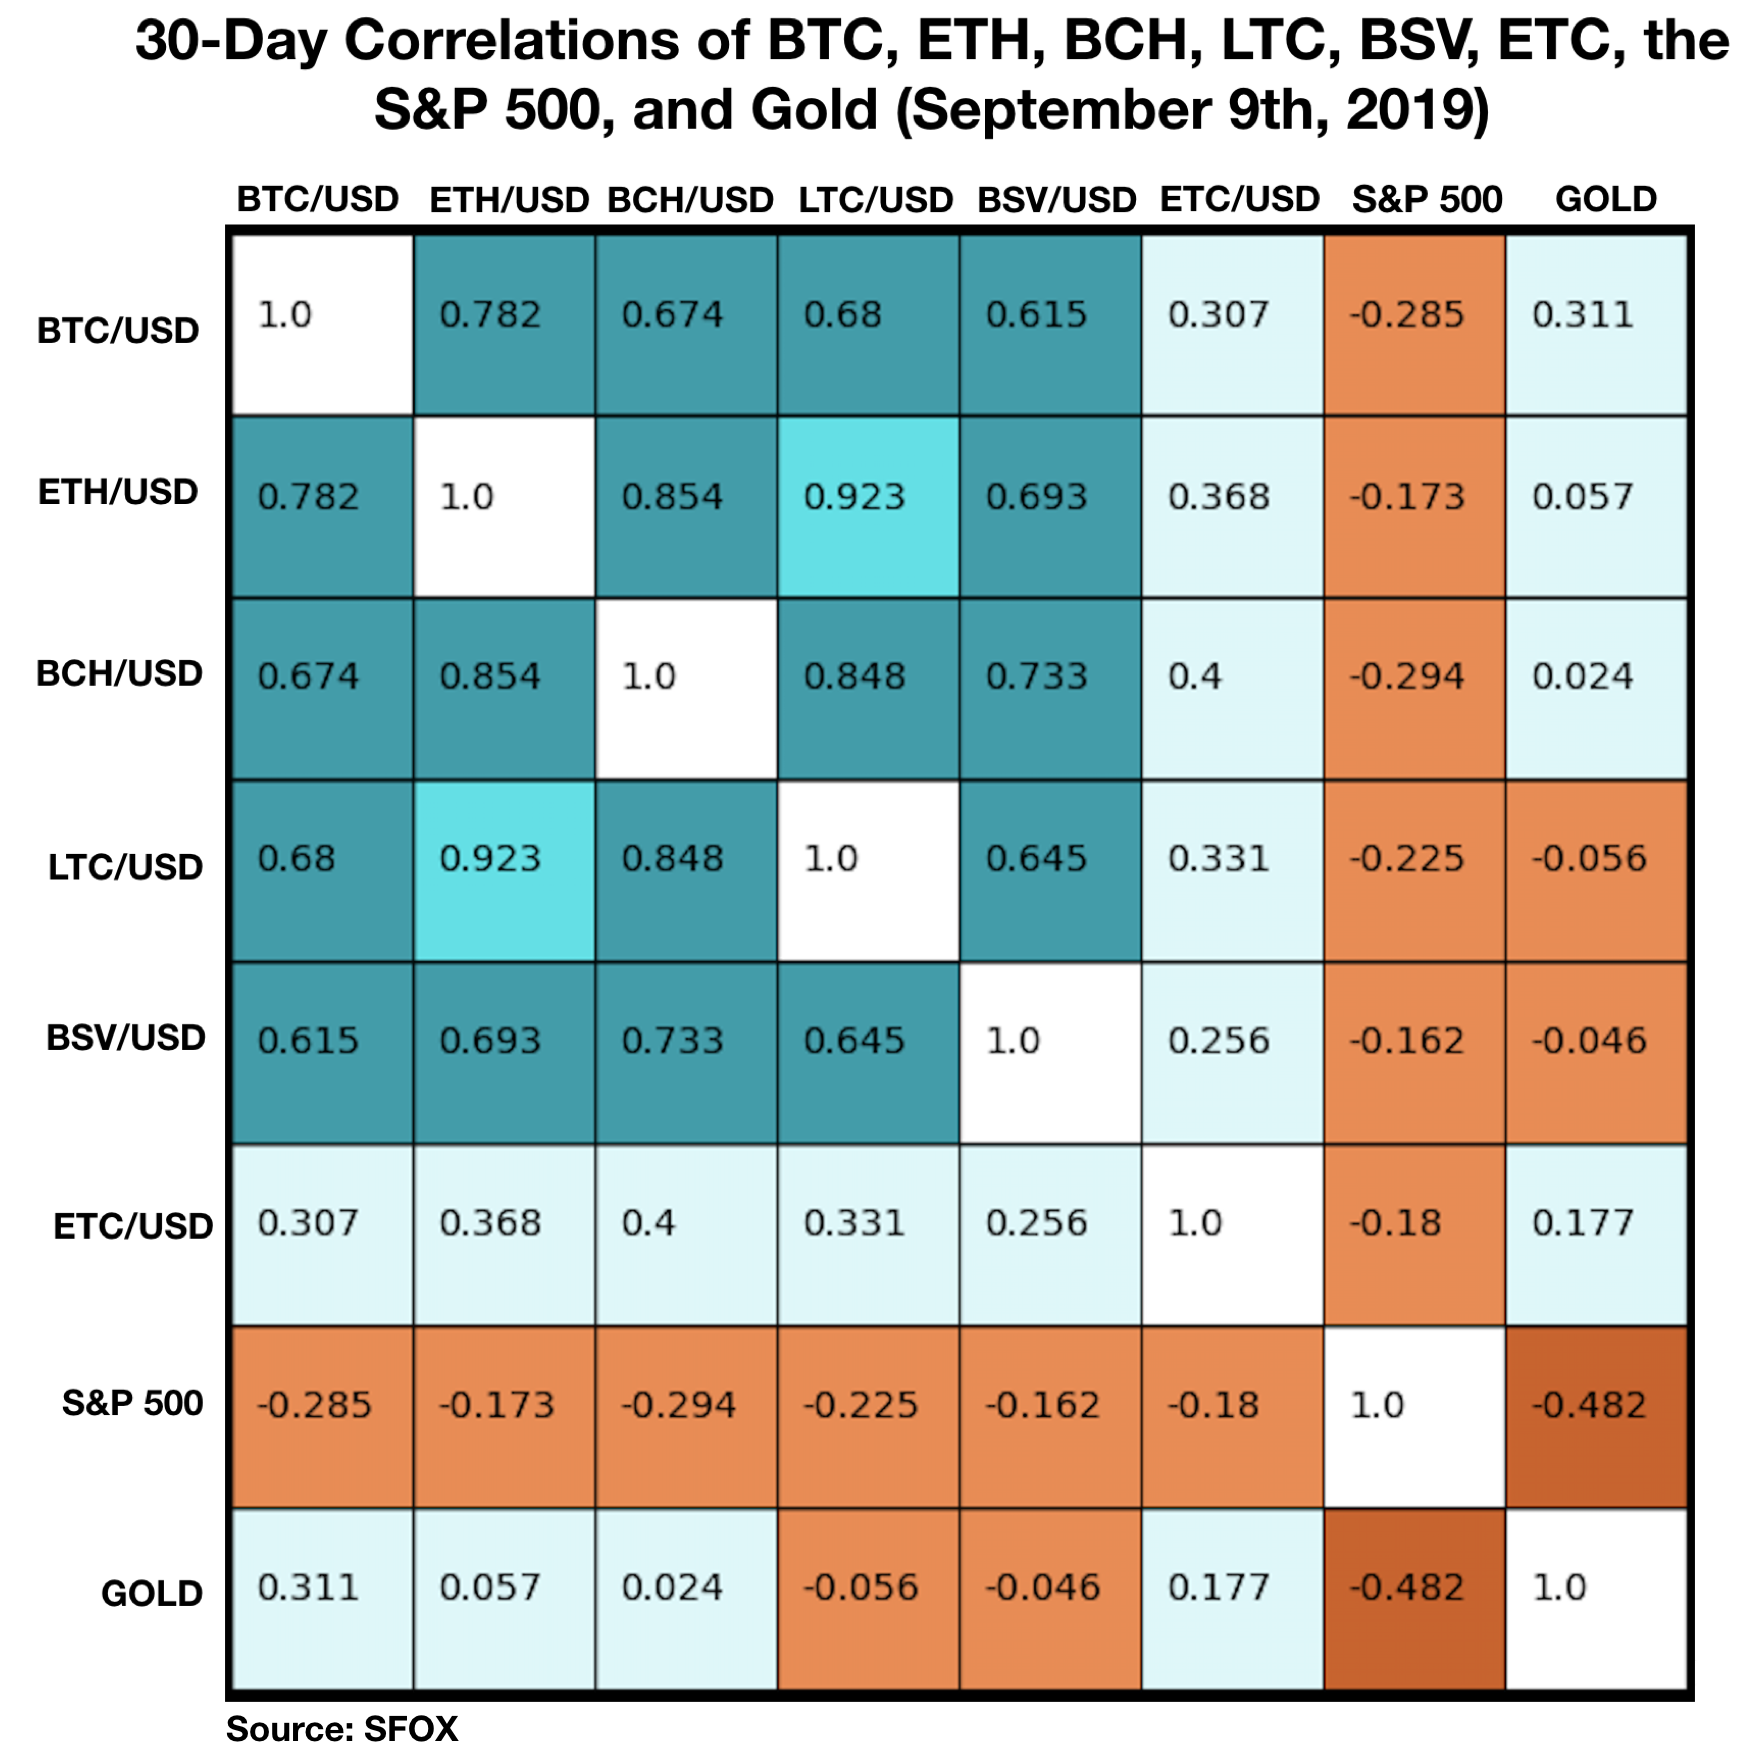
Notice also that cryptoasset correlations with the S&P 500 and gold are both relatively close to 0, reinforcing the hypothesis made by some that cryptocurrencies, as a relatively uncorrelated asset class, may be uniquely valuable as a diversification tool in portfolio management.
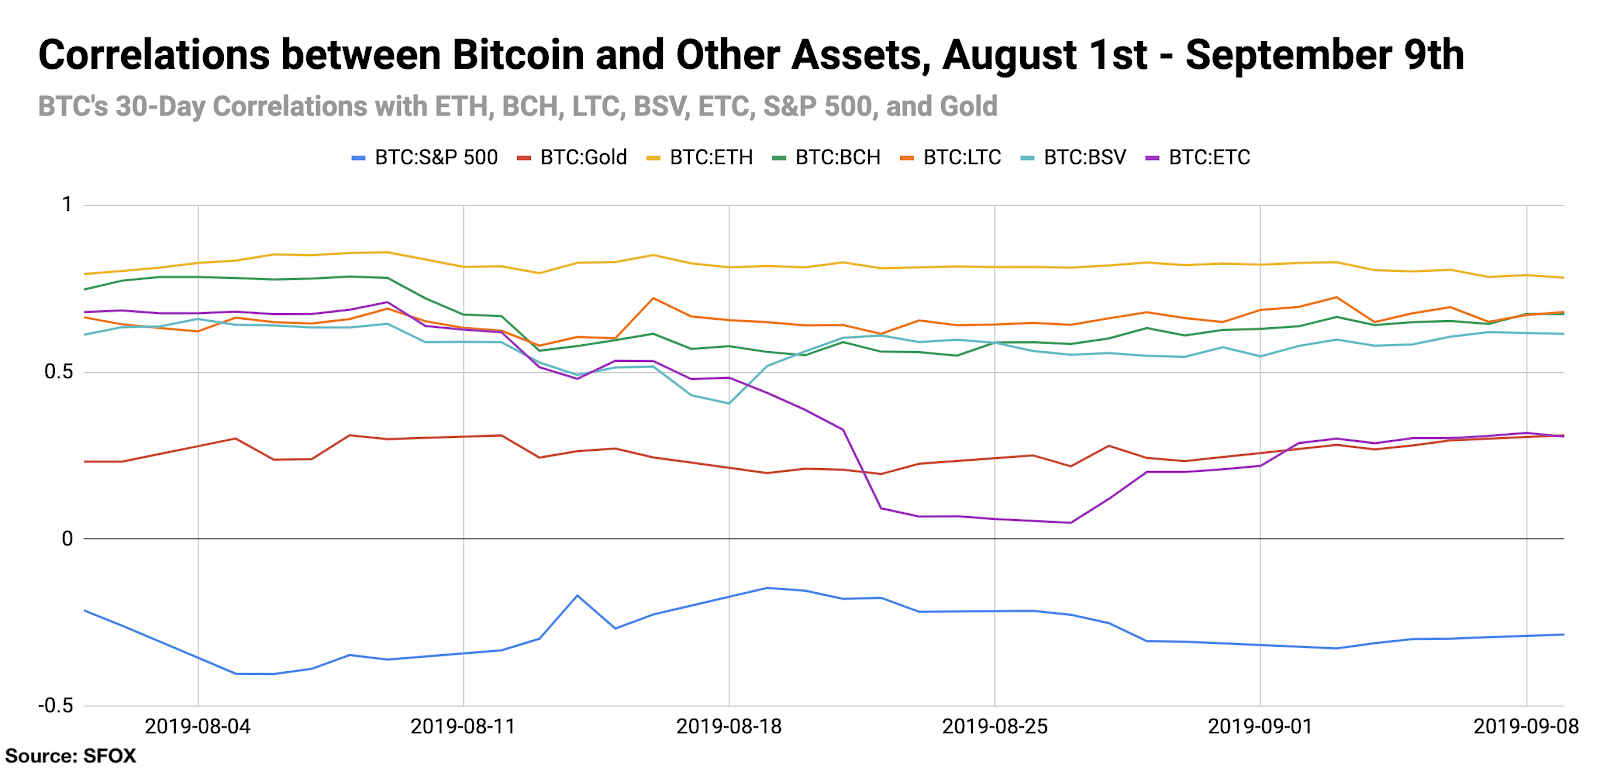
For a more complete look at BTC’s correlations with other assets throughout the past five weeks, see the following graph:
Appendix: Data Sources, Definitions, and Methodology
All cryptocurrency prices are denominated in USD unless otherwise noted.
We use two different in-house volatility indices in creating these reports:
1. 30-day historical volatility (HV) indices are calculated from daily snapshots over the relevant 30-day period using the formula:
30-Day HV Index = σ(Ln(P1/P0), Ln(P2/P1), …, Ln(P30/P29)) * √(365)
2. Daily historical volatility (HV) indices are calculated from 1440 snapshots over the relevant 24-hour period using the formula:
Daily HV Index = σ(Ln(P1/P0), Ln(P2/P1), …, Ln(P1440/P1439))* √(1440)
S&P 500 performance data are collected from Yahoo! Finance using GSPC (S&P 500 Index) data. Gold performance data are collected from Yahoo! Finance using XAU (Philadelphia Gold and Silver Index) data.
The cryptoasset data sources aggregated for crypto prices, correlations, and volatility indices presented and analyzed in this report are the following eight exchanges, the order-book data of which we collect and store in real time:
- bitFlyer
- Binance
- Bitstamp
- Bittrex
- Coinbase
- Gemini
- itBit
- Kraken
Our indices’ integration of data from multiple top liquidity providers offers a more holistic view of the crypto market’s minute-to-minute movement. There are two problems with looking to any single liquidity provider for marketwide data:
- Different liquidity providers experience widely varying trade volumes. For example: according to CoinMarketCap, Binance saw over $20 billion USD in trading volume in November 2018, whereas Bitstamp saw $2 billion USD in trading volume in that same time — an order-of-magnitude difference. Therefore, treating any single liquidity provider’s data as representative of the overall market is myopic.
- Liquidity providers routinely experience interruptions in data collection. For instance, virtually every exchange undergoes regularly scheduled maintenance at one point or another, at which point their order books are unavailable and they therefore have no market data to collect or report. At best, this can prevent analysts from getting a full picture of market performance; at worst, it can make it virtually impossible to build metrics such as historical volatility indices.
Building volatility indices that collect real-time data from many distinct liquidity providers mitigates both of these problems: collecting and averaging data from different sources prevents any single source from having an outsized impact on our view of the market, and it also allows us to still have data for analysis even if one or two of those sources experience interruptions. We use five redundant data collection mechanisms for each exchange in order to ensure that our data collection will remain uninterrupted even in the event of multiple failures.
The above references an opinion and is for informational purposes only. It is not intended as and does not constitute investment advice, and is not an offer to buy or sell or a solicitation of an offer to buy or sell any cryptocurrency, security, product, service or investment. Seek a duly licensed professional for investment advice. The information provided here or in any communication containing a link to this site is not intended for distribution to, or use by, any person or entity in any jurisdiction or country where such distribution or use would be contrary to law or regulation or which would subject SFOX, Inc. or its affiliates to any registration requirement within such jurisdiction or country. Neither the information, nor any opinion contained in this site constitutes a solicitation or offer by SFOX, Inc. or its affiliates to buy or sell any cryptocurrencies, securities, futures, options or other financial instruments or provide any investment advice or service.