Summary:
- The SFOX Multi-Factor Market Index has been downgraded from mildly bullish to neutral as of July 8th.
- BTC options volume appears to be outpacing spot trading volume, potentially suggesting the expectation of significant price movement in the future.
- The latest correlation data do not support the “altcoin season” hypothesis.
- Confidence in ETH appears to be resistant to the most recent news of DeFi thefts.
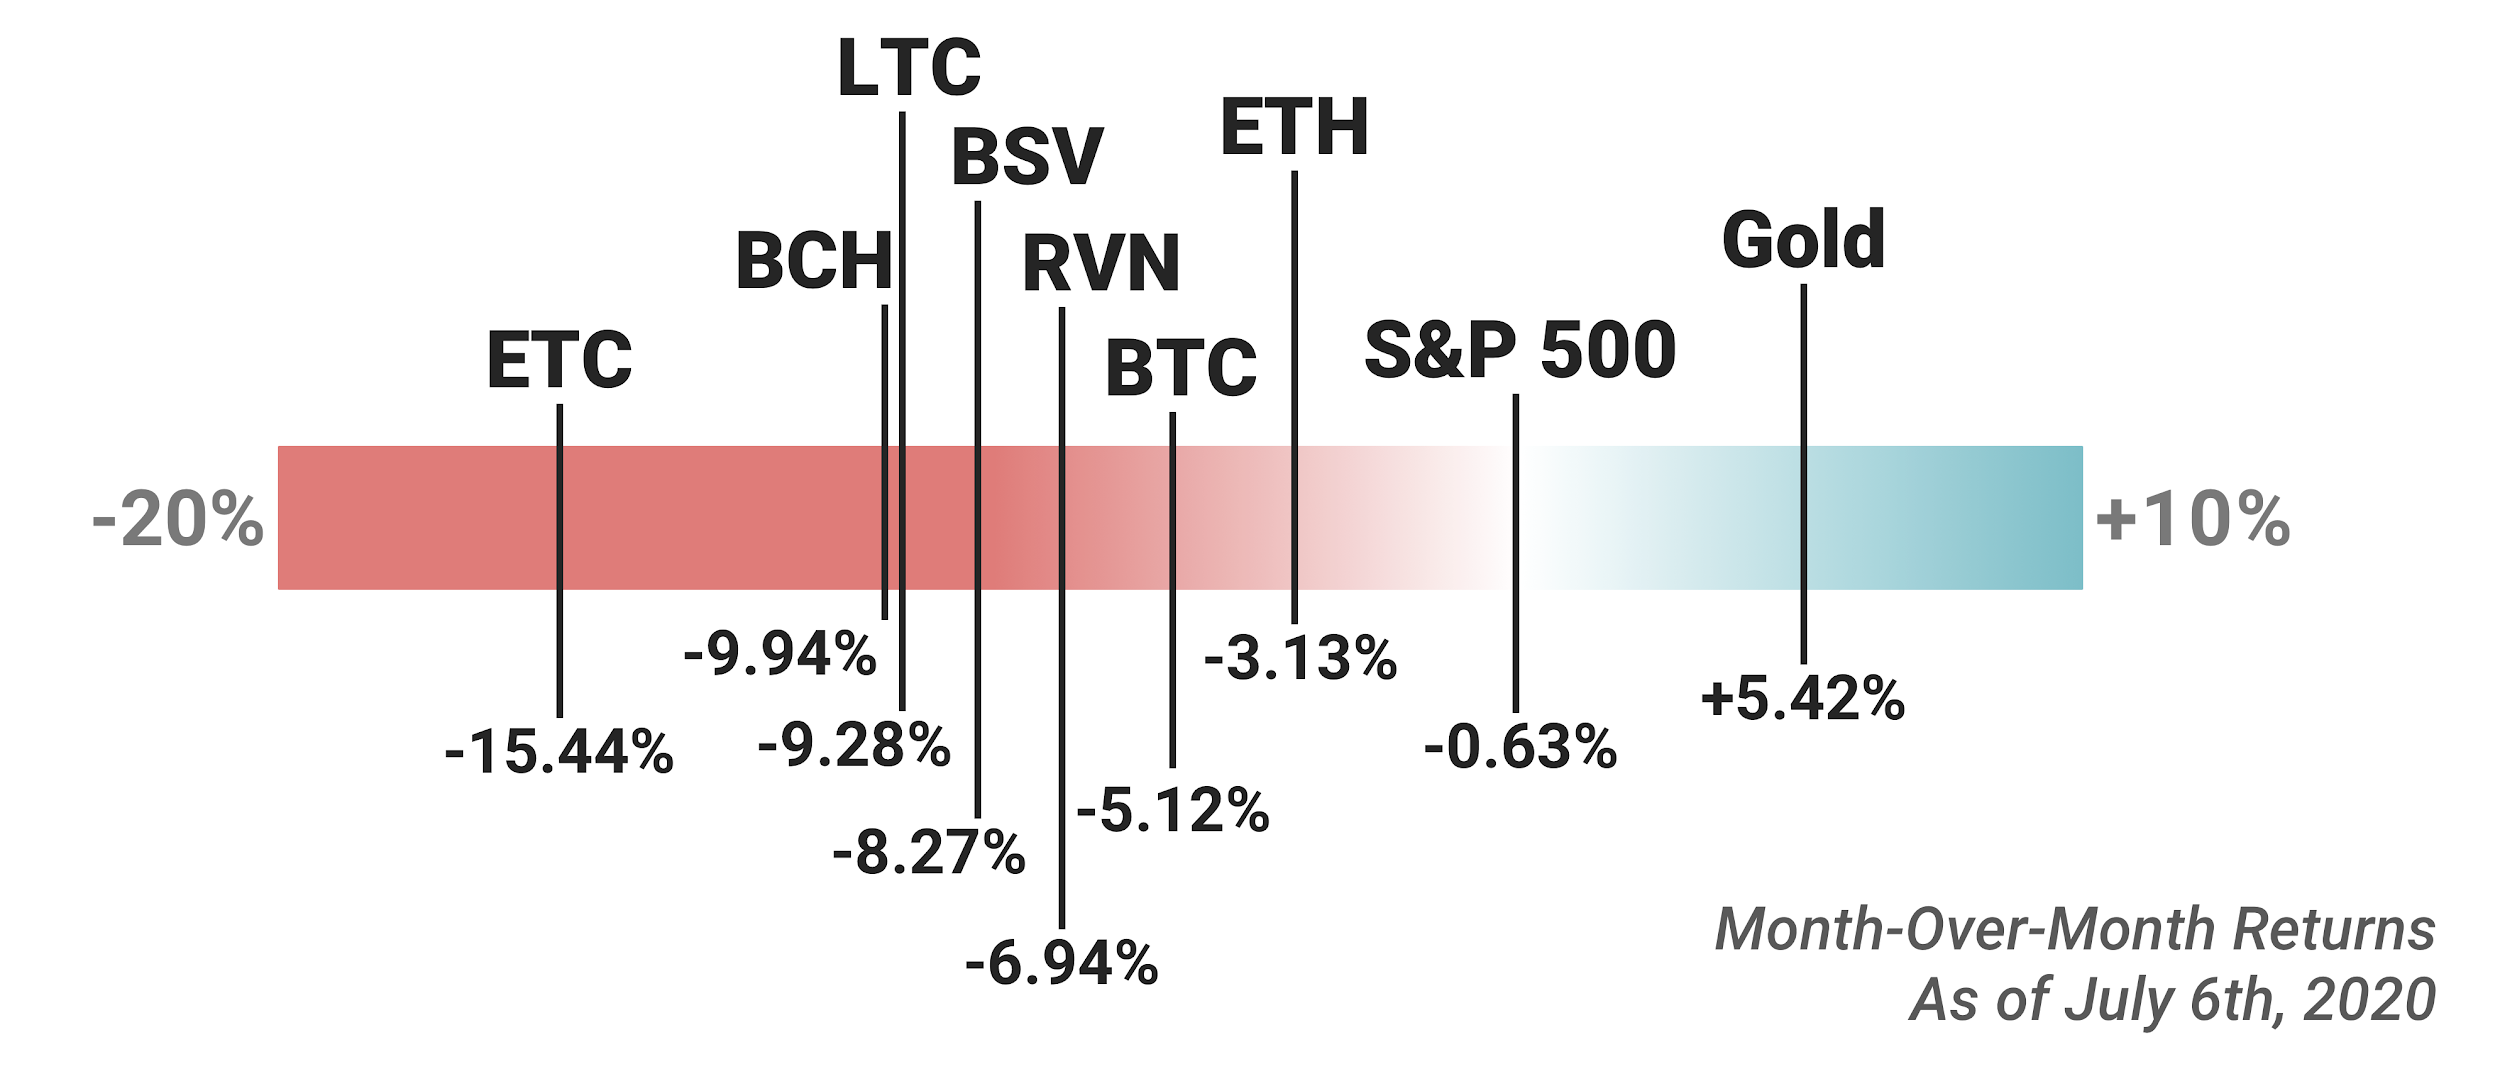
- As of July 6th, all major crypto assets are down month-over-month, with ETH showing the smallest losses (-3.13%) and ETC showing the greatest (-15.44%). Gold is up 5.42% month-over-month, and the S&P 500 is down 0.63% month-over-month.
In the July 2020 edition of the SFOX crypto market report, the SFOX Research Team reviews the crypto market’s volatility, correlations, and other performance metrics throughout the past month. We’ve aggregated price, volume, correlations, and volatility data from eight leading exchanges and liquidity providers to analyze the global performance of 7 major crypto assets — BTC, ETH, BCH, LTC, BSV, ETC, and RVN — all of which are available for smart-routing-powered trading on our trading platform.
The following is a report and analysis of their volatility, price correlations, and further development in the month of June and early July. (For more information on data sources and methodology, please consult the appendix at the end of the report.)
SFOX’s Current Crypto Market Outlook: Neutral
Based on our calculations and analyses, the SFOX Multi-Factor Market Index, which was set at mildly bullish a month ago, has been downgraded to neutral as of July 8th, 2020.
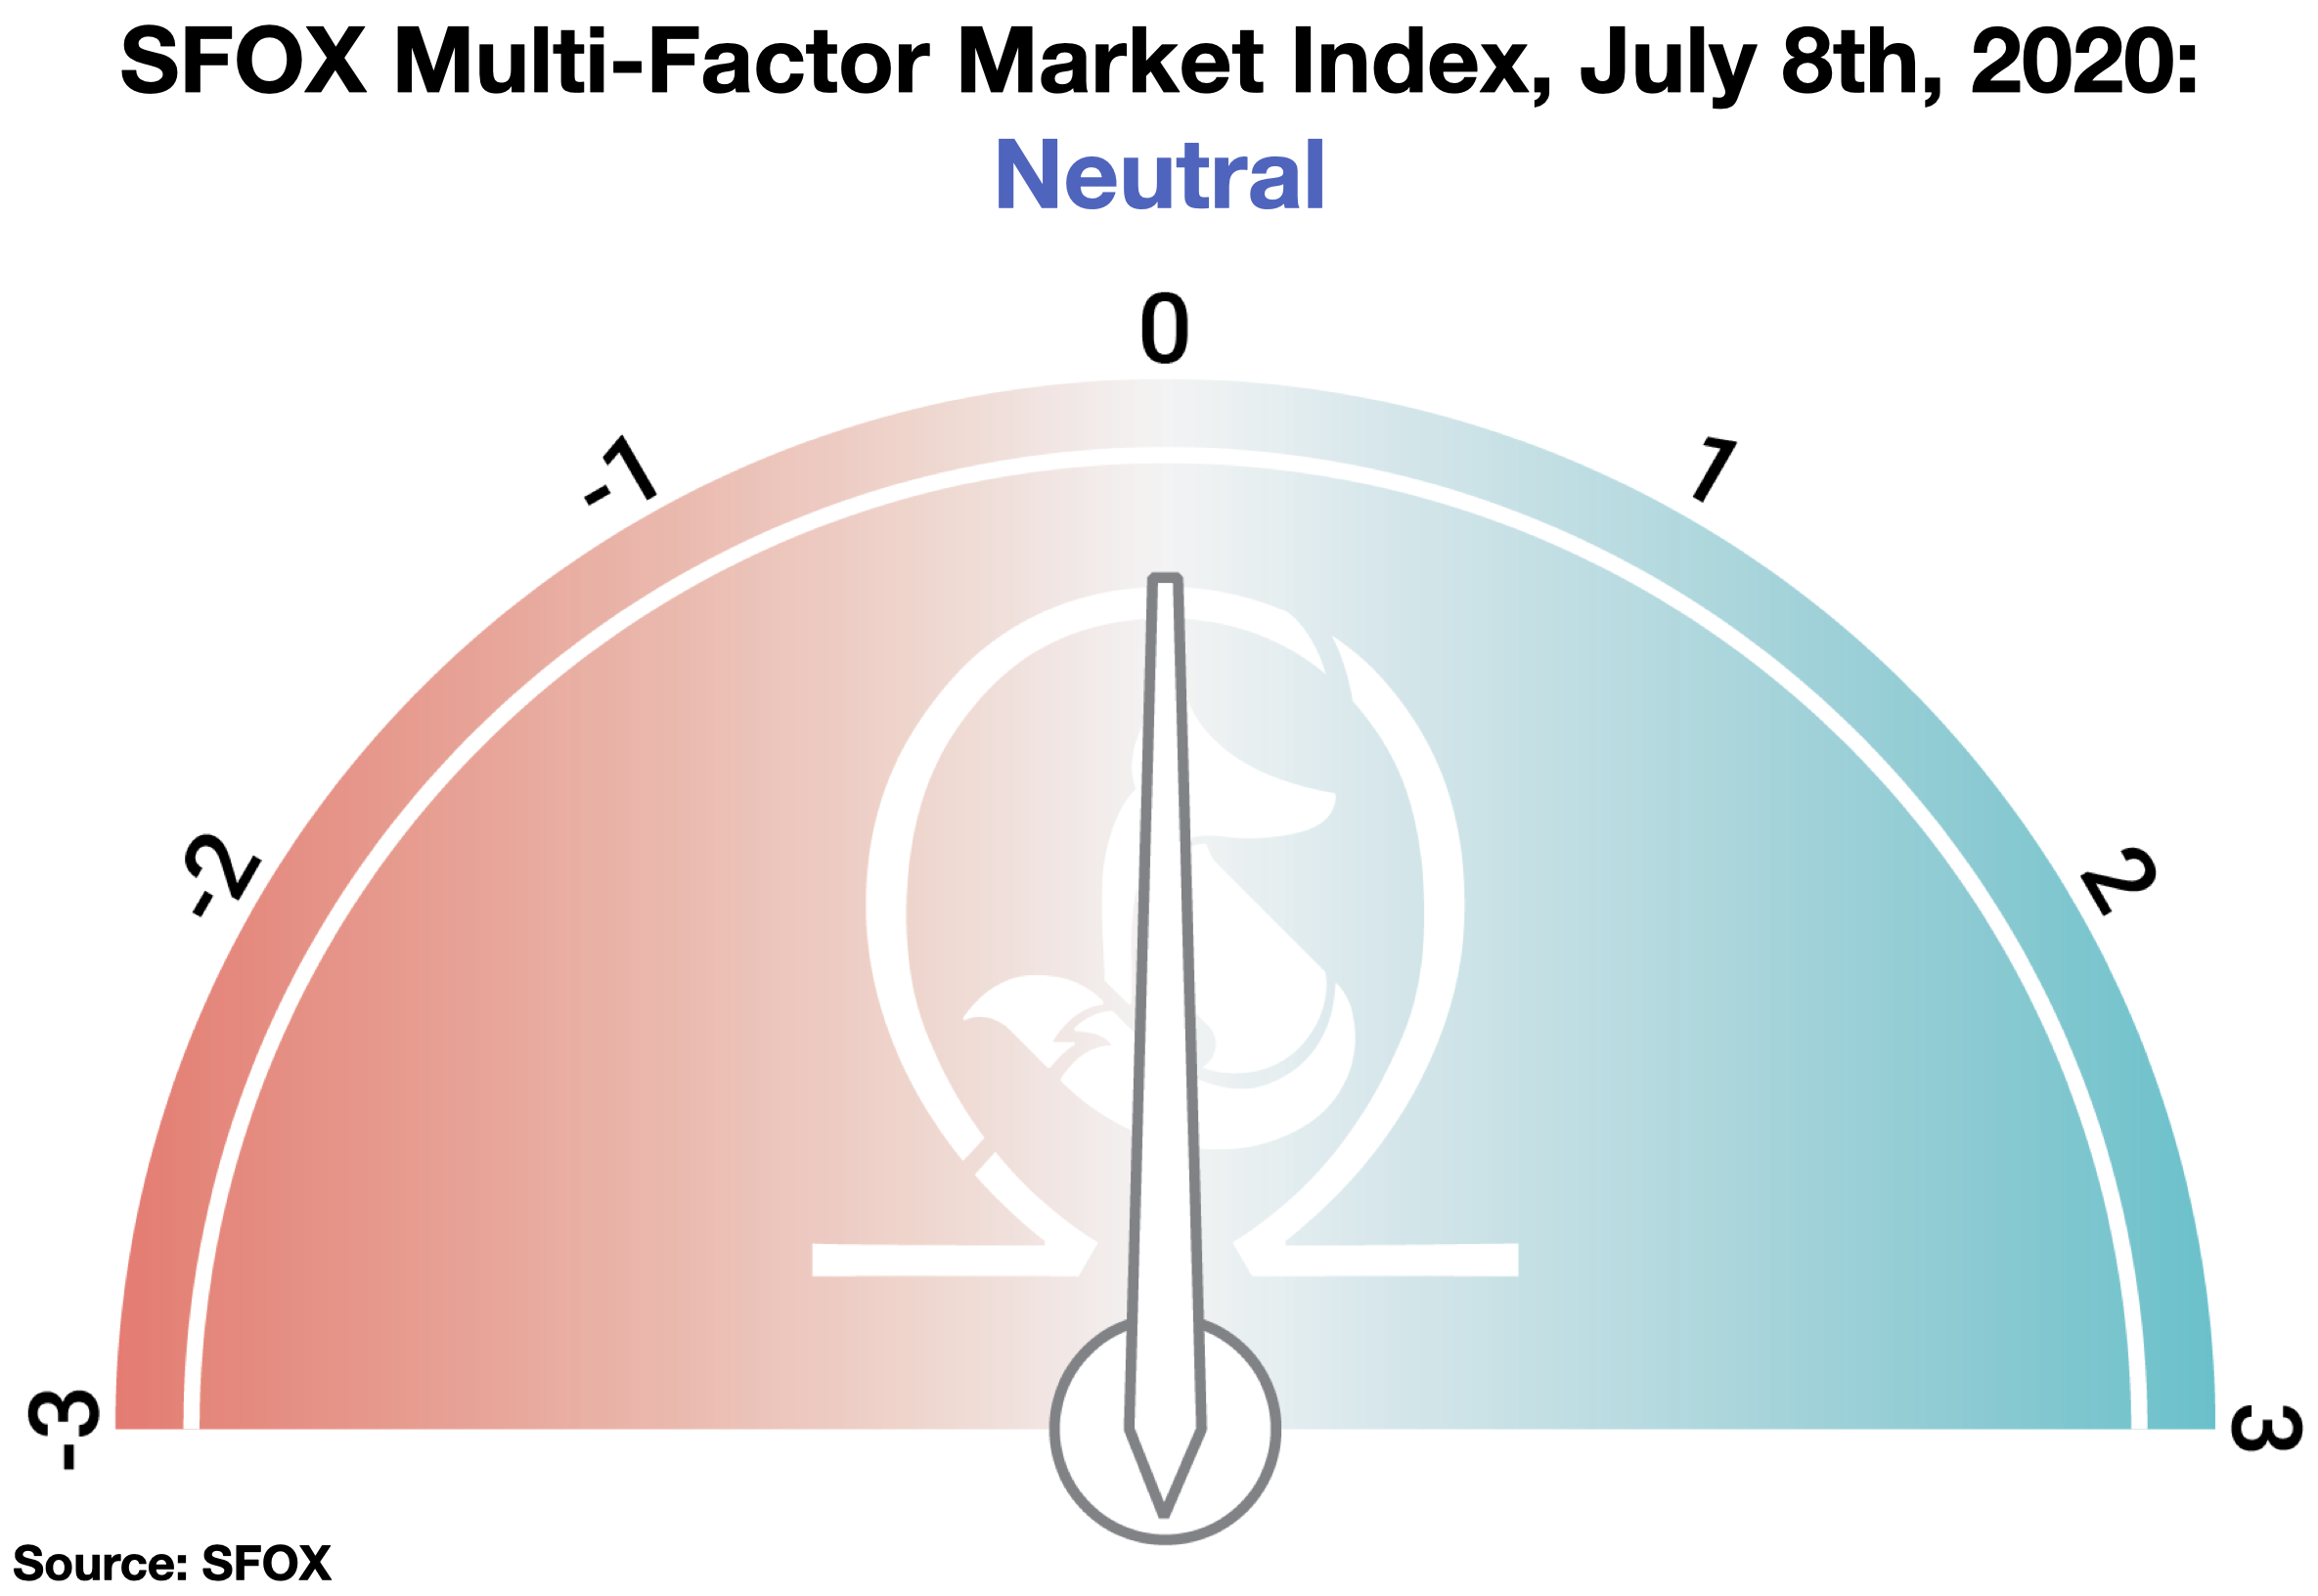
We determine the monthly value of this index by using proprietary, quantifiable indicators to analyze five market factors: price momentum, trade volume, market sentiment, volatility, and continued advancement of the sector. It is calculated using a proprietary formula that combines quantified, marketwide data on asset performance, search traffic, blockchain transactions, and more. The index ranges from highly bearish to highly bullish.
All the crypto assets available for trading on SFOX showed month-over-month losses as of July 6th. Among those assets, ETH—which showed the highest month-over-month gains in this asset group in the previous two months—showed the smallest losses (-3.13%), while ETC showed the greatest losses (-15.44%). Meanwhile, gold was up 5.42% month-over-month, and the S&P 500 was relatively flat at -0.63% month-over-month losses.
The name of the game in the past month has been anticipation, with crypto market participants appearing unsure yet expectant of what may happen next in the market. From growth in the BTC options open interest, to sustained expectations surrounding DeFi and the rollout of ETH staking, to potential PayPal crypto products and CFTC crypto guidelines in the offing, to continued macroeconomic uncertainty, the market appears across many dimensions to be waiting for what comes next—which may explain the Multi-Factor Market Index’s current rating of neutral.
Get the SFOX edge in volatile times through our smart-routing order types that capture the best available crypto prices from all major trading venues directly from your SFOX account.
What’s Happened in the Last Month and What to Watch Next
Markets
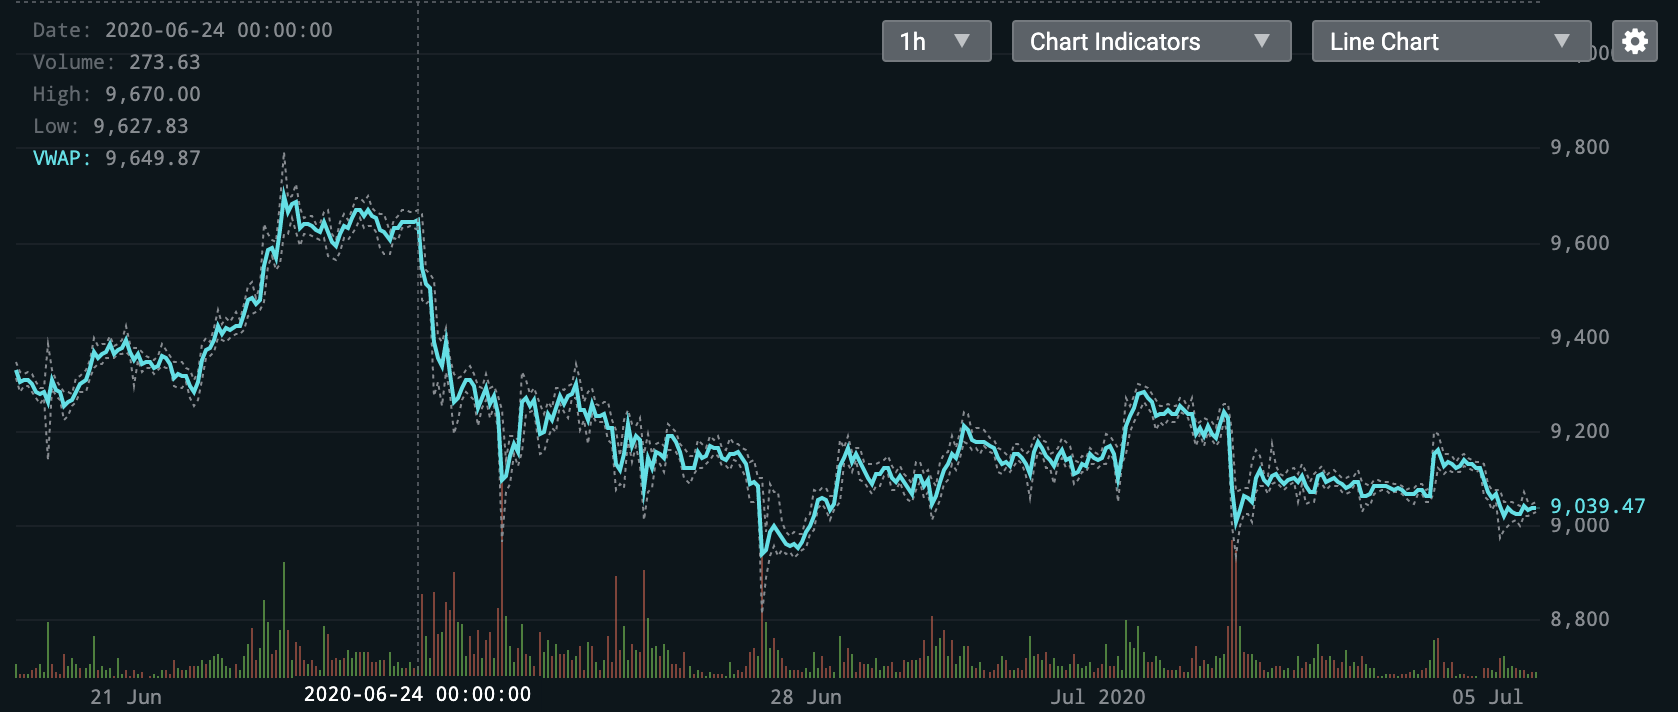
Roughly $1 billion of Bitcoin options contracts expired, corresponding with an 8.9% drop in the price of BTC over the course of 3 days; BTC options volume appears to be outpacing spot trading volume, potentially suggesting the expectation of significant price movement in the future (June 24th – June 27th).
About 60% of total open interest in the BTC options market expired on June 26th, an event which was preceded by a run-up in open interest to about $1.9 billion. While there was speculation of these expirations driving the price of BTC as high as $11,000 or as low as $7,000 based on strike price concentration, BTC’s actual movement during this period ended up being less dramatic, falling from a peak of $9660.35 on the 24th to a low of $8812.80 on the 27th.
It’s interesting to note that trading volume in the BTC spot market since the middle of May has been relatively quiet (see first chart below) while open interest in BTC options has only been increasing: in the time since the $1 billion expiration, total open interest has already returned to roughly $1.1 billion (see second chart below).
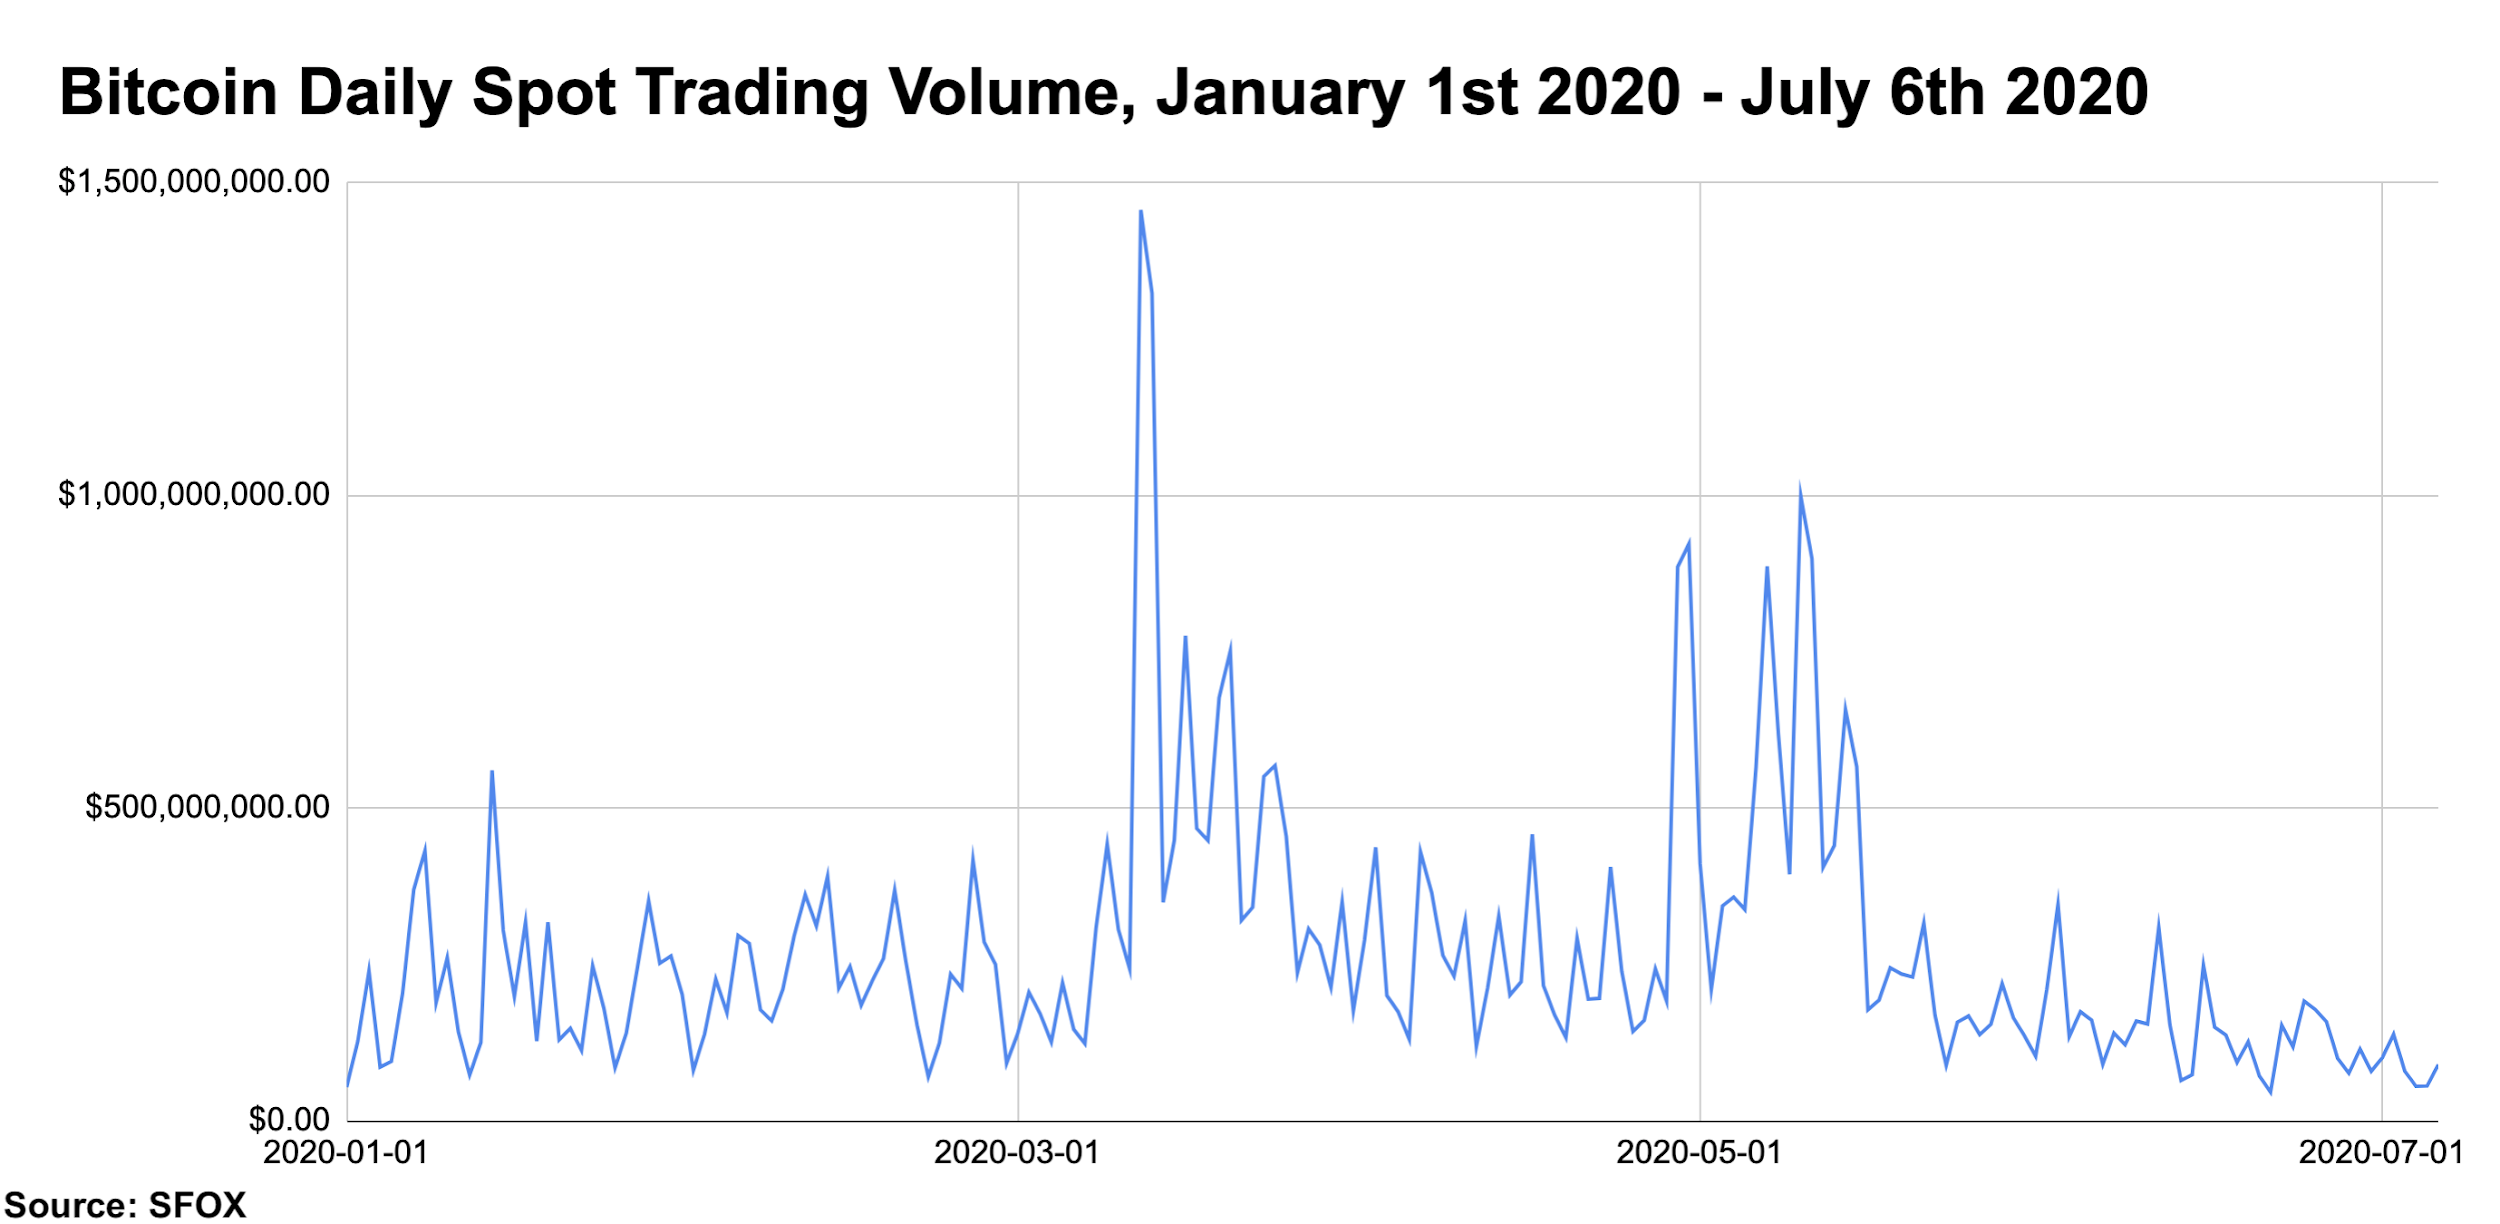
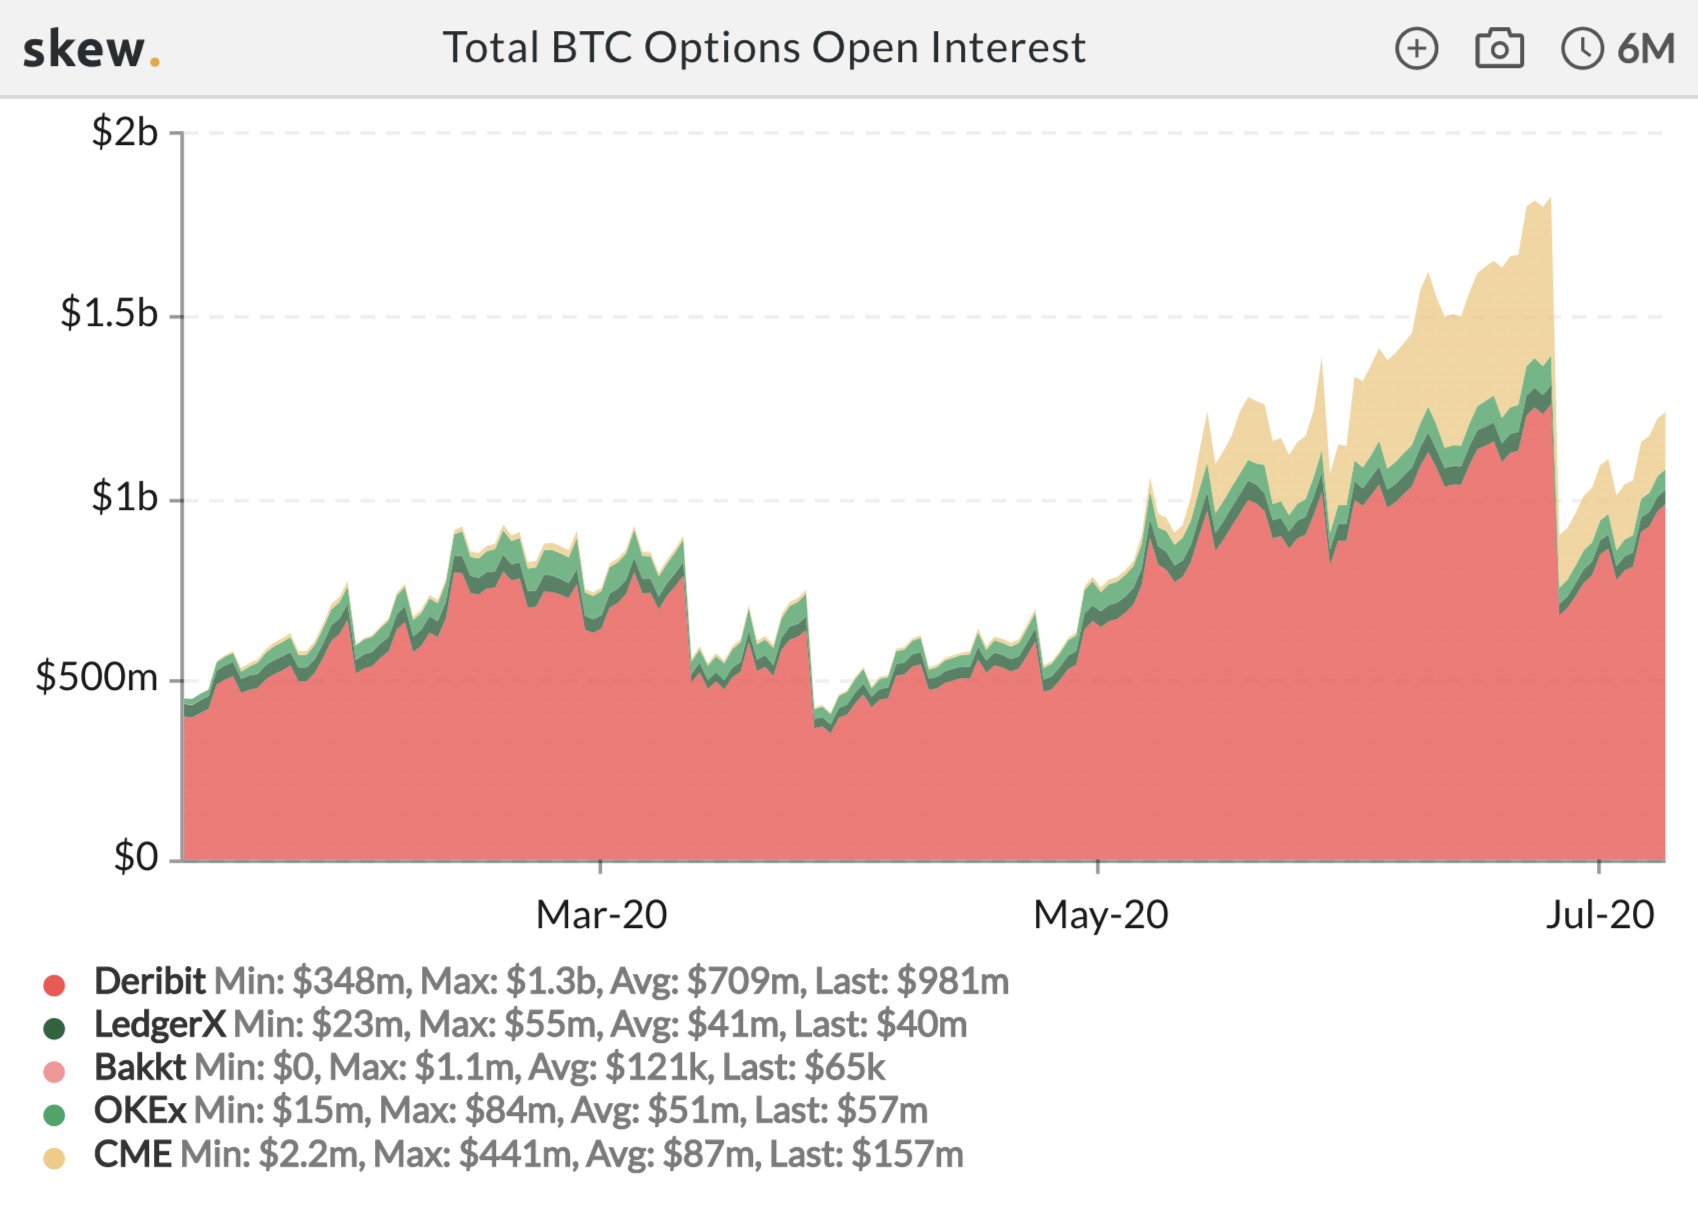
While it’s difficult to definitively explain the discrepancy between spot and options volume, it may be the case that some traders are expecting the price of BTC to move significantly in the future as general macroeconomic uncertainty continues to unfold in global markets, as sometimes happens when assets break out of the kind of relatively tight price band in which BTC currently seems to be.
Leading altcoins are maintaining strong, positive correlations with BTC, challenging the narrative that “altcoin season” is reigning in the sector.
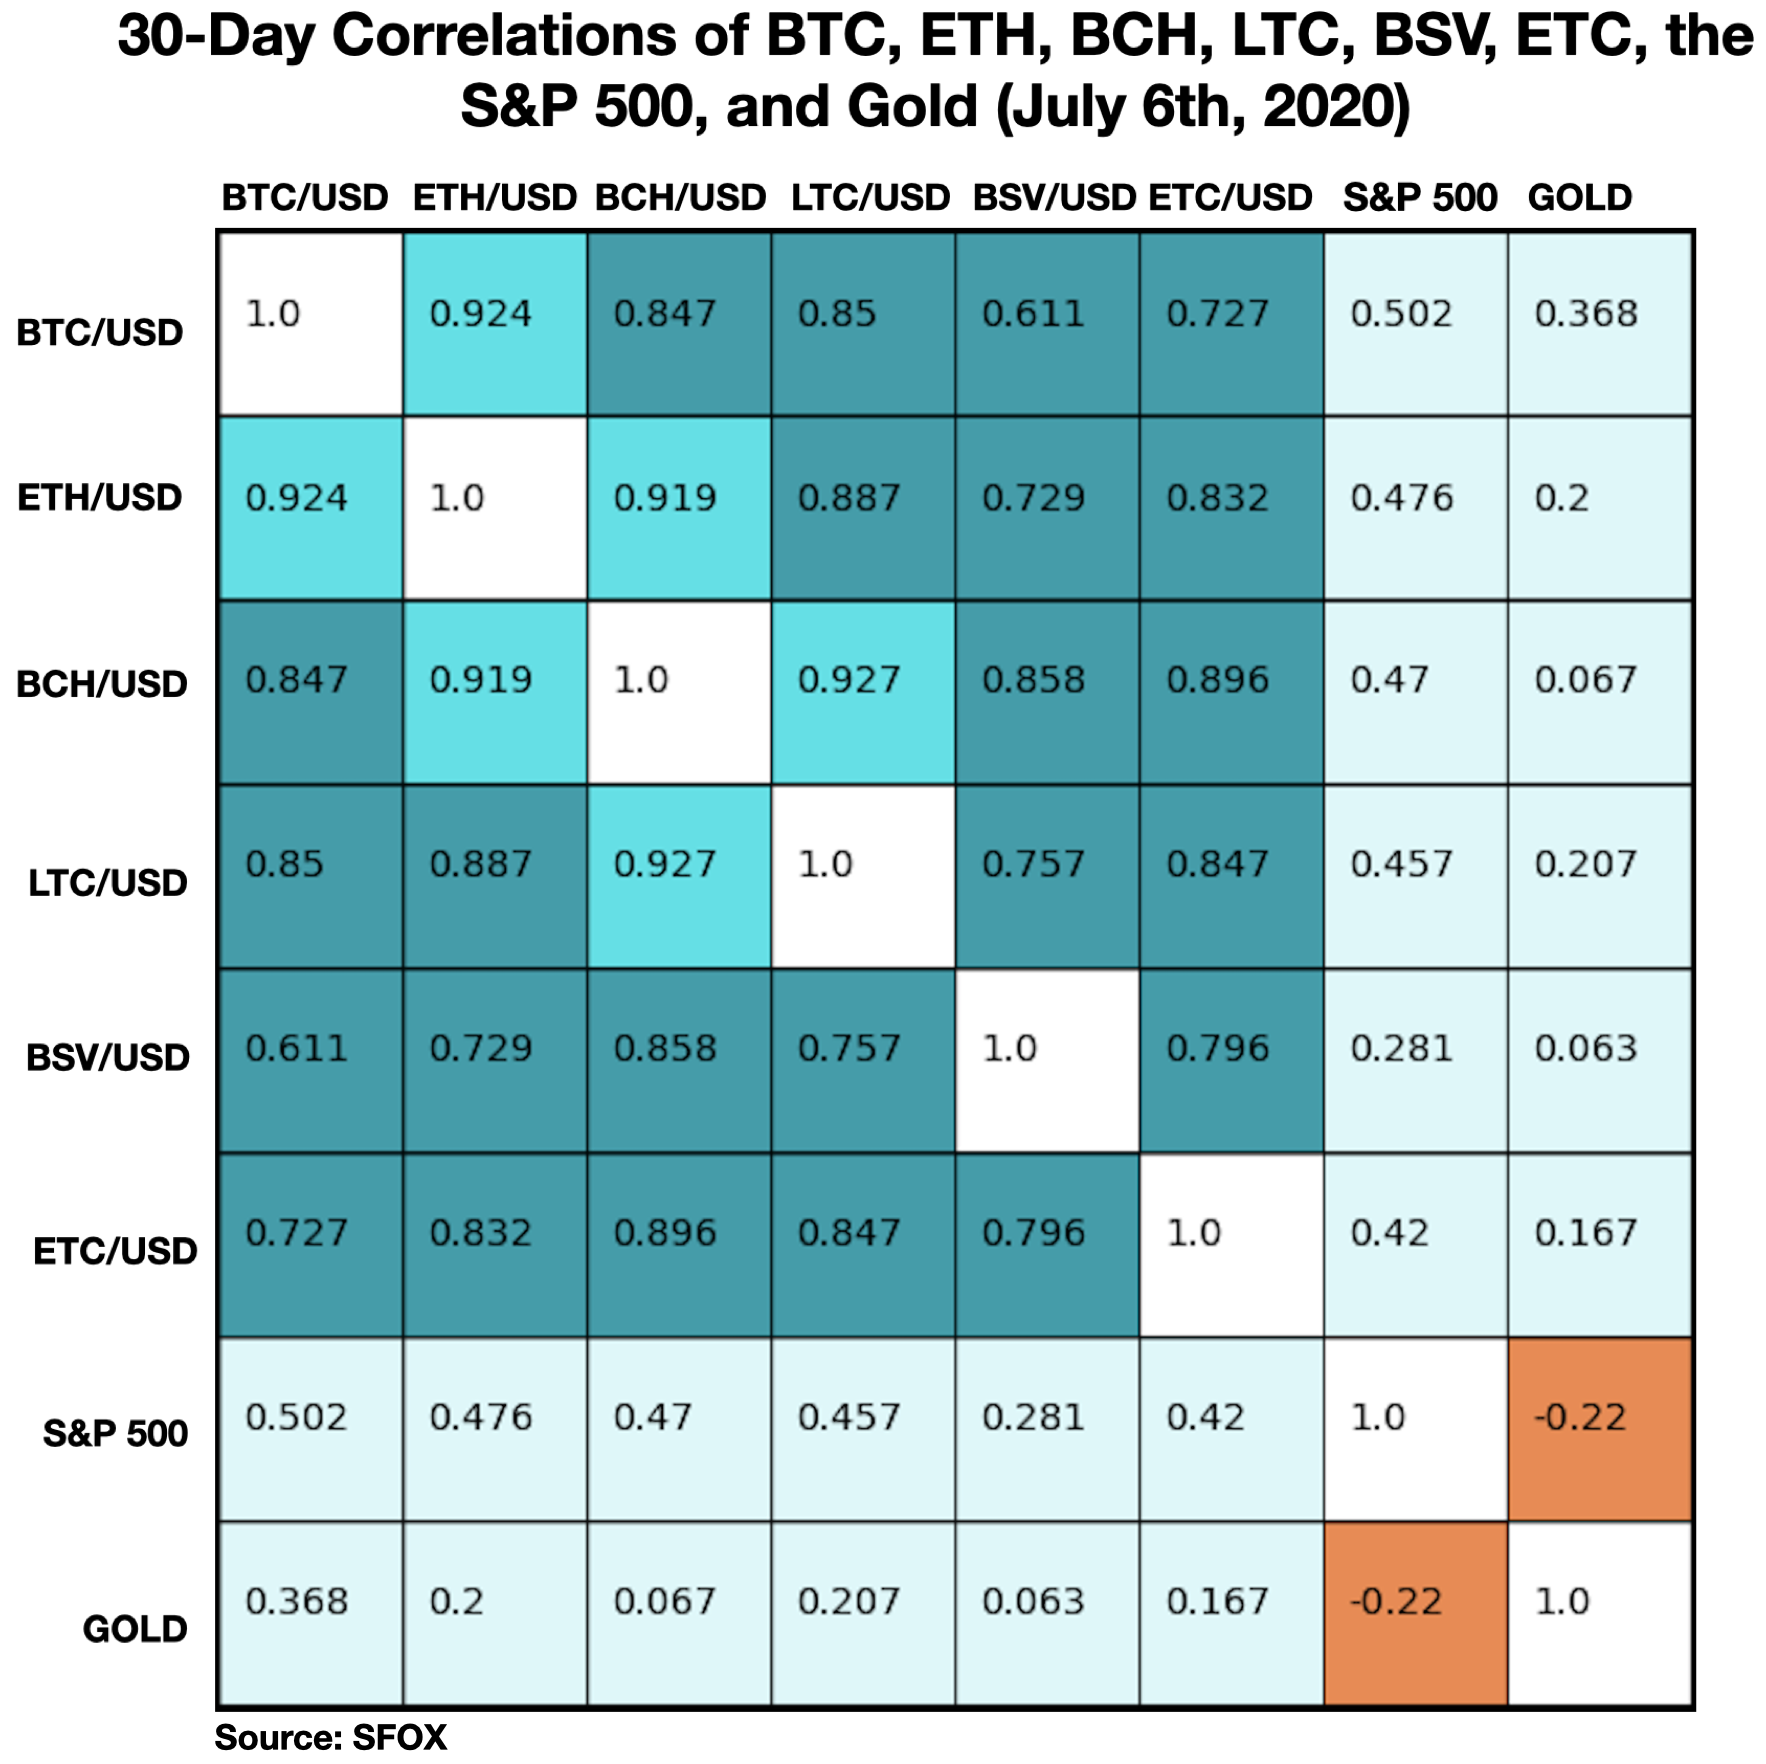
With BTC trading in a fairly narrow band of prices, many have been claiming that an “altcoin season,” in which crypto assets other than bitcoin decouple from BTC and perform independently, is upon us. However, the most recent marketwide correlations data suggest that, at least as far as major altcoins are concerned, this is not the case: over the last 5 weeks, LTC, BCH, and ETH have all maintained 30-day correlations of no lower than 0.69 with BTC, a significantly positive correlation value.

In all fairness, BSV and ETC saw lower (positive) levels of correlation with BTC earlier in June, but even these assets have seen higher levels of BTC correlation in early July. It may well be the case that crypto assets with distinct and proven use-cases eventually decouple from BTC and perform on their own, but especially at this moment when BTC’s utility as a deflationary store of value is being tested on the macroeconomic stage for the first time, it may still be premature to expect that kind of decoupling.
ETH’s price performance appears to be relatively stable despite a $500 million DeFi theft (June 29th).
Decentralized finance (DeFi) liquidity provider Balancer Pool stole $500,000 worth of tokens by exploiting a loophole in their protocol, which subsequently inspired the community of Compound, the leading DeFi protocol by amount of ETH locked in the protocol, to revise the rules governing the distribution of their own token, COMP. The performance of ETH seemed unfazed by these developments, however: ETH’s price actually stabilized more, with decreased volatility levels (32.06% vs. 38.66%), following news of the attack. When viewed in the context of ETH’s gains in the past two months on news of DeFi developments and anticipation of the rollout of ETH staking, this resiliency of ETH to news of a DeFi hack may suggest that market participants are confident in the underlying value propositions of staking and DeFi, irrespective of the shortcomings of a particular DeFi protocol.
Products
PayPal is rumored to be planning a rollout of direct crypto sales to users of PayPal and Venmo (June 22nd).
According to multiple sources, PayPal is reportedly planning to provide in-app buys and sells of cryptocurrencies along with a native wallet to support crypto storage. Sources anticipated a time-to-launch of 3 months or less. This kind of rollout would provide direct crypto access to PayPal’s 325 million users, a potential stimulus for the mainstream adoption of crypto in the retail world.
Regulatory
The CFTC announced plans to develop a “holistic framework” for cryptocurrencies by 2024 (July 8th).
The U.S. Commodity Futures Trading Commission published their 2020-2024 strategic plan that included a commitment to “develop a holistic framework to promote responsible innovation in digital assets.” This kind of clear regulatory framework is crucial to the offering of futures and other derivatives products for more cryptocurrencies, which will help provide sophisticated and institutional investors with more exposure to the emerging crypto asset class.
Technical Developments
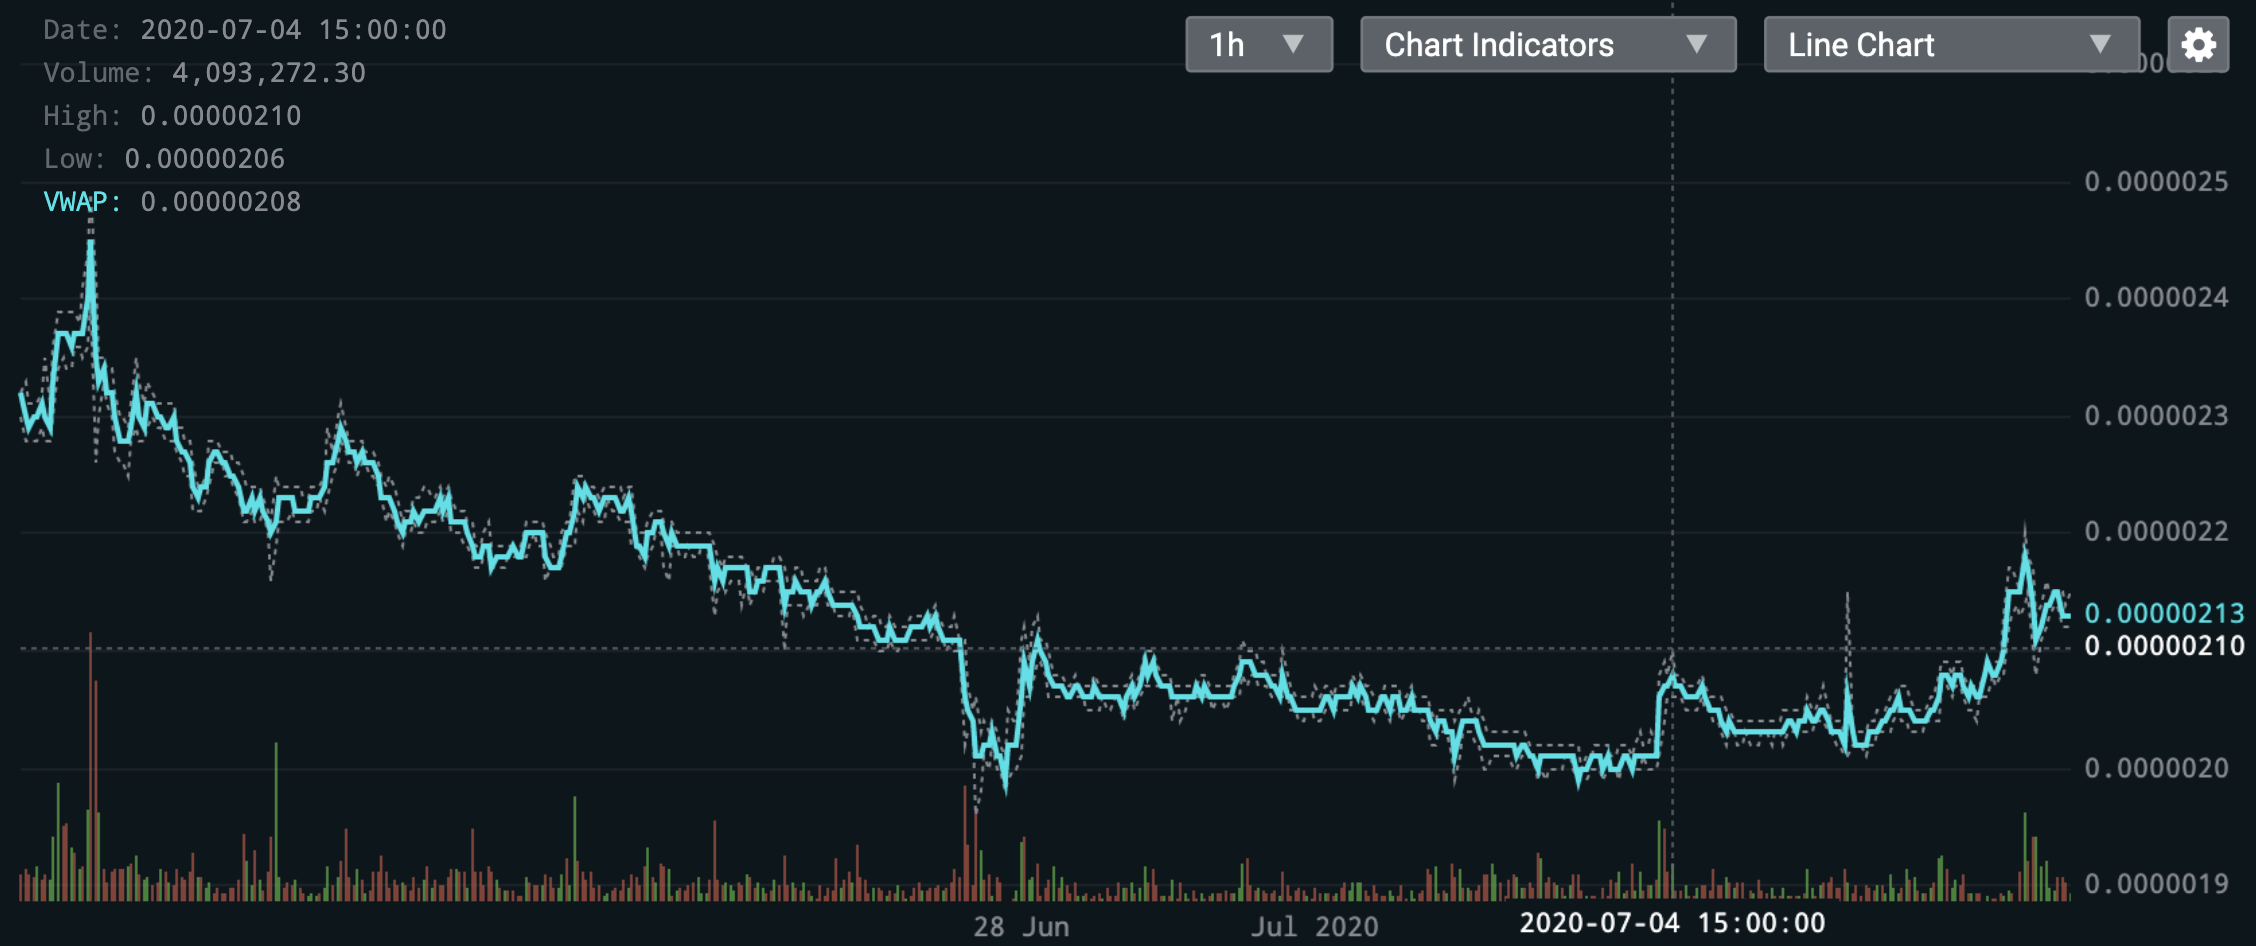
Ravencoin suffered from the exploitation of an inflation bug by 1.4% at the time of writing; the bug has since been fixed (July 2nd – July 7th).
As Ravencoin developer Tron Black detailed in a postmortem, the Ravencoin blockchain suffered what appears to have been a maliciously inserted code update that allowed bad actors to generate roughly 315 million RVN without mining, effectively increasing the total supply of RVN (set at 21 billion) by 1.5%. According to research by CryptoScope, the team that discovered the exploit and notified the Ravencoin development team, this inflation bug had been exploited as early as May 9th, gradually creating more RVN every few hours. The issue was made public by Tron on July 2nd and fixed through a community-adopted update on July 4th. The price of RVN/BTC, which had been on a downward trend since June 18th, experienced a spike on July 4th that appears to have started an upward trend, potentially reflecting the resolution of this issue.
The Details: Crypto Price, Volatility, and Correlation Data, June 1st – July 6th, 2020
Price Performance: A Narrow Band
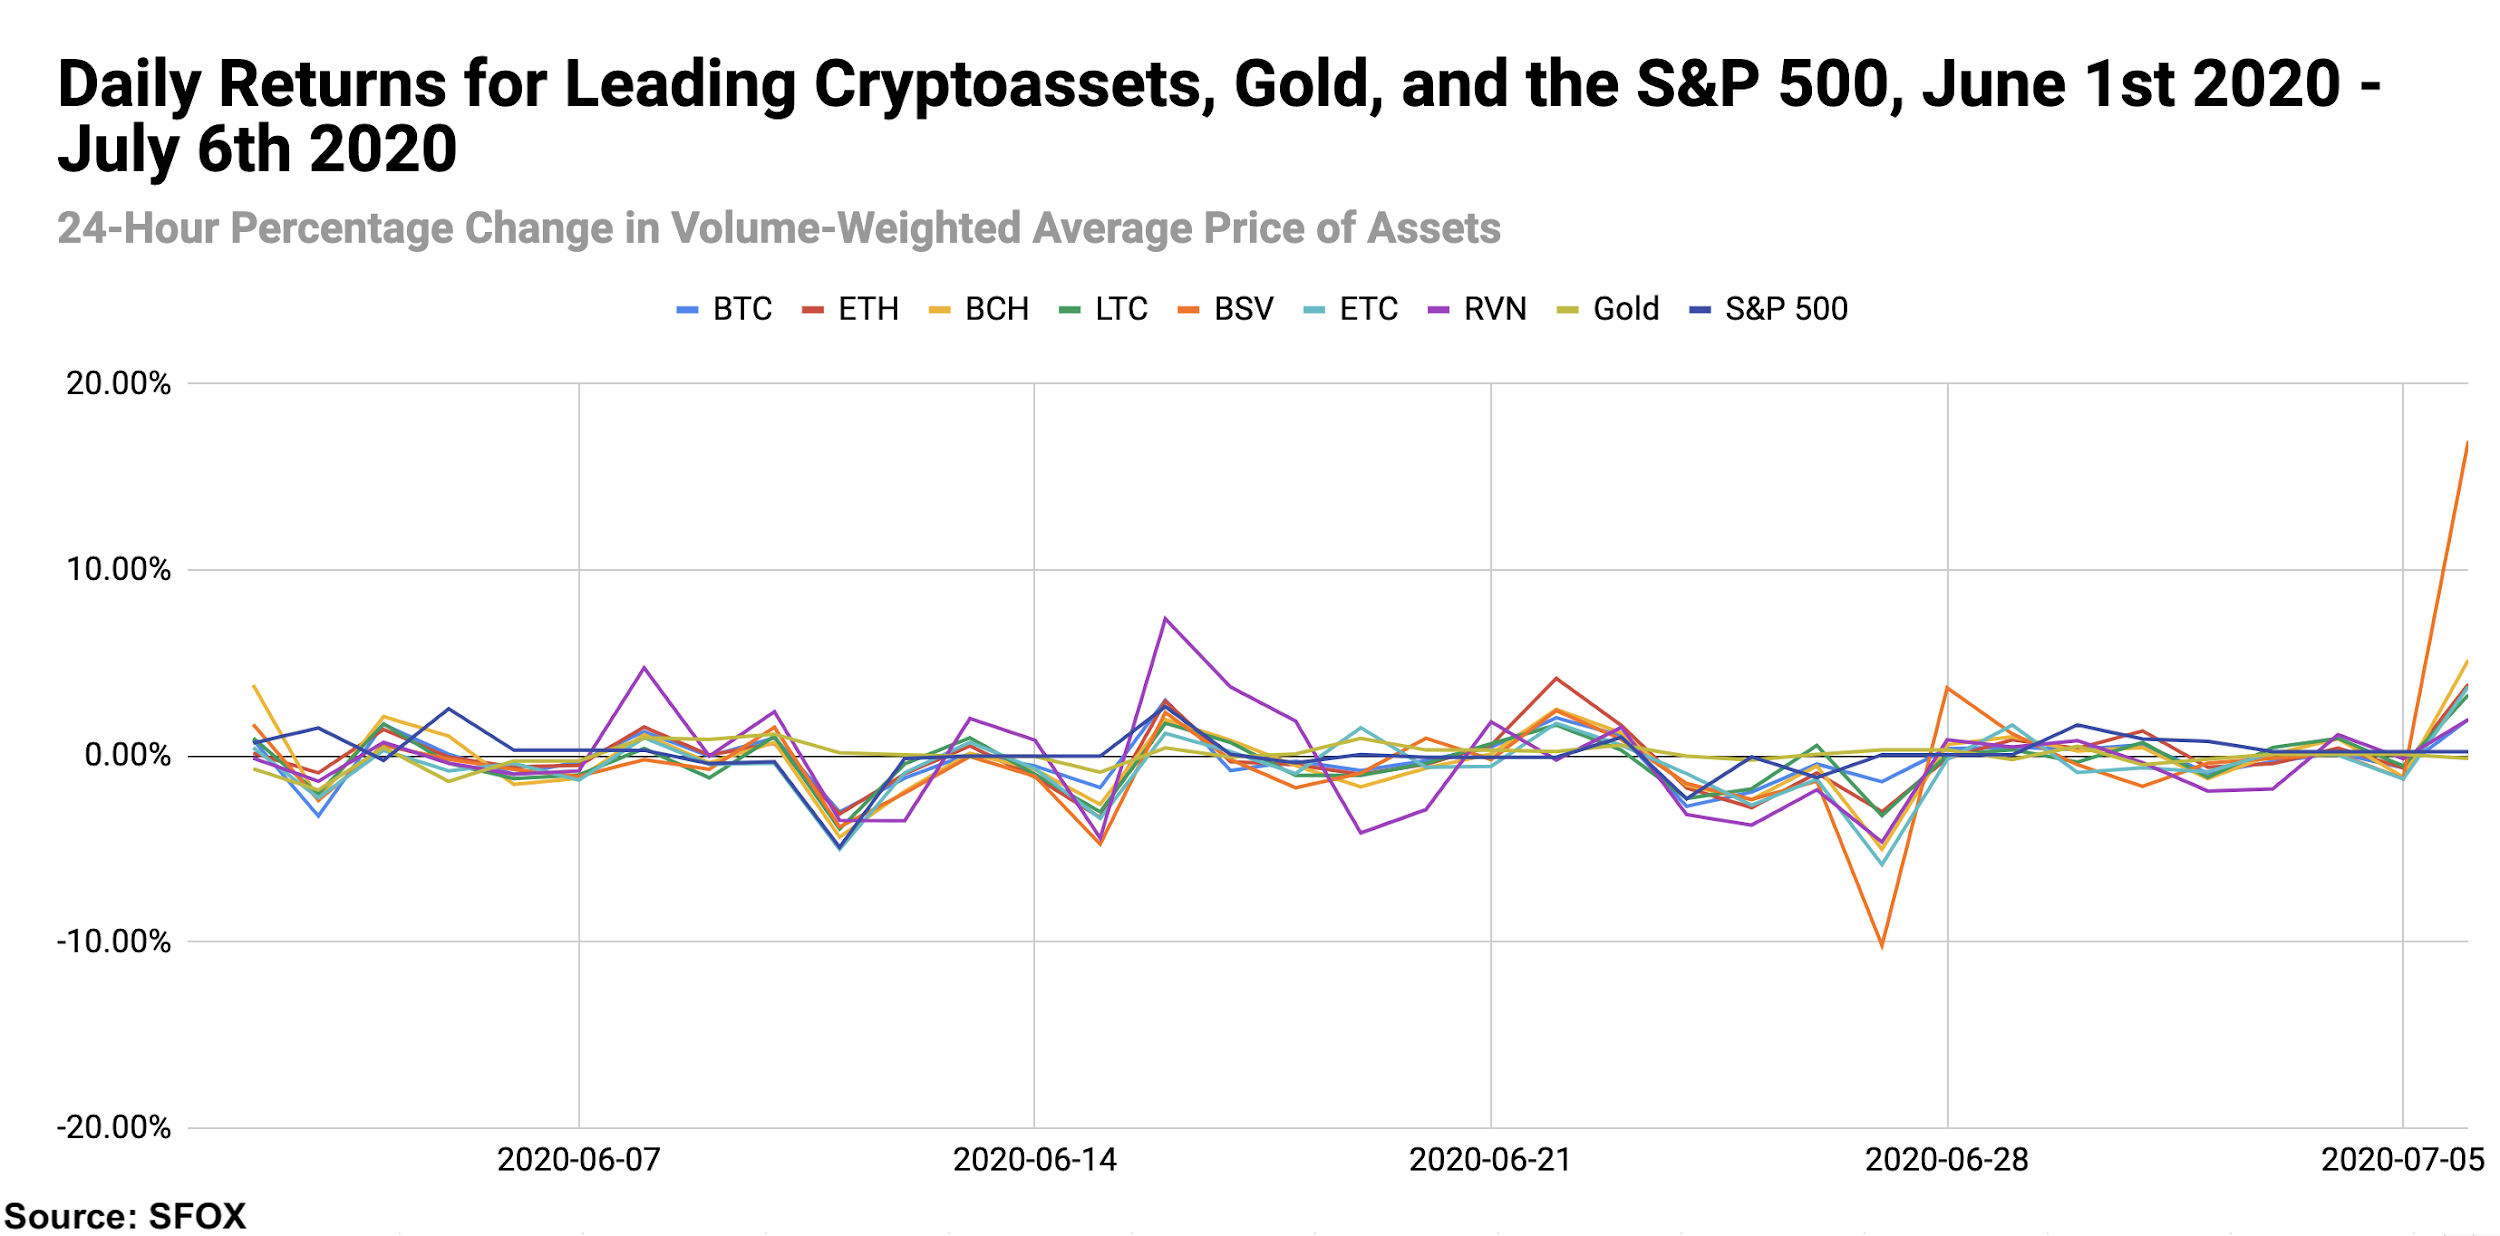
The volume-weighted average price of Bitcoin (BTC) has ranged between $9034.86 and $9869.54 from the start of June to now, gravitating more recently toward the lower end of that spectrum. 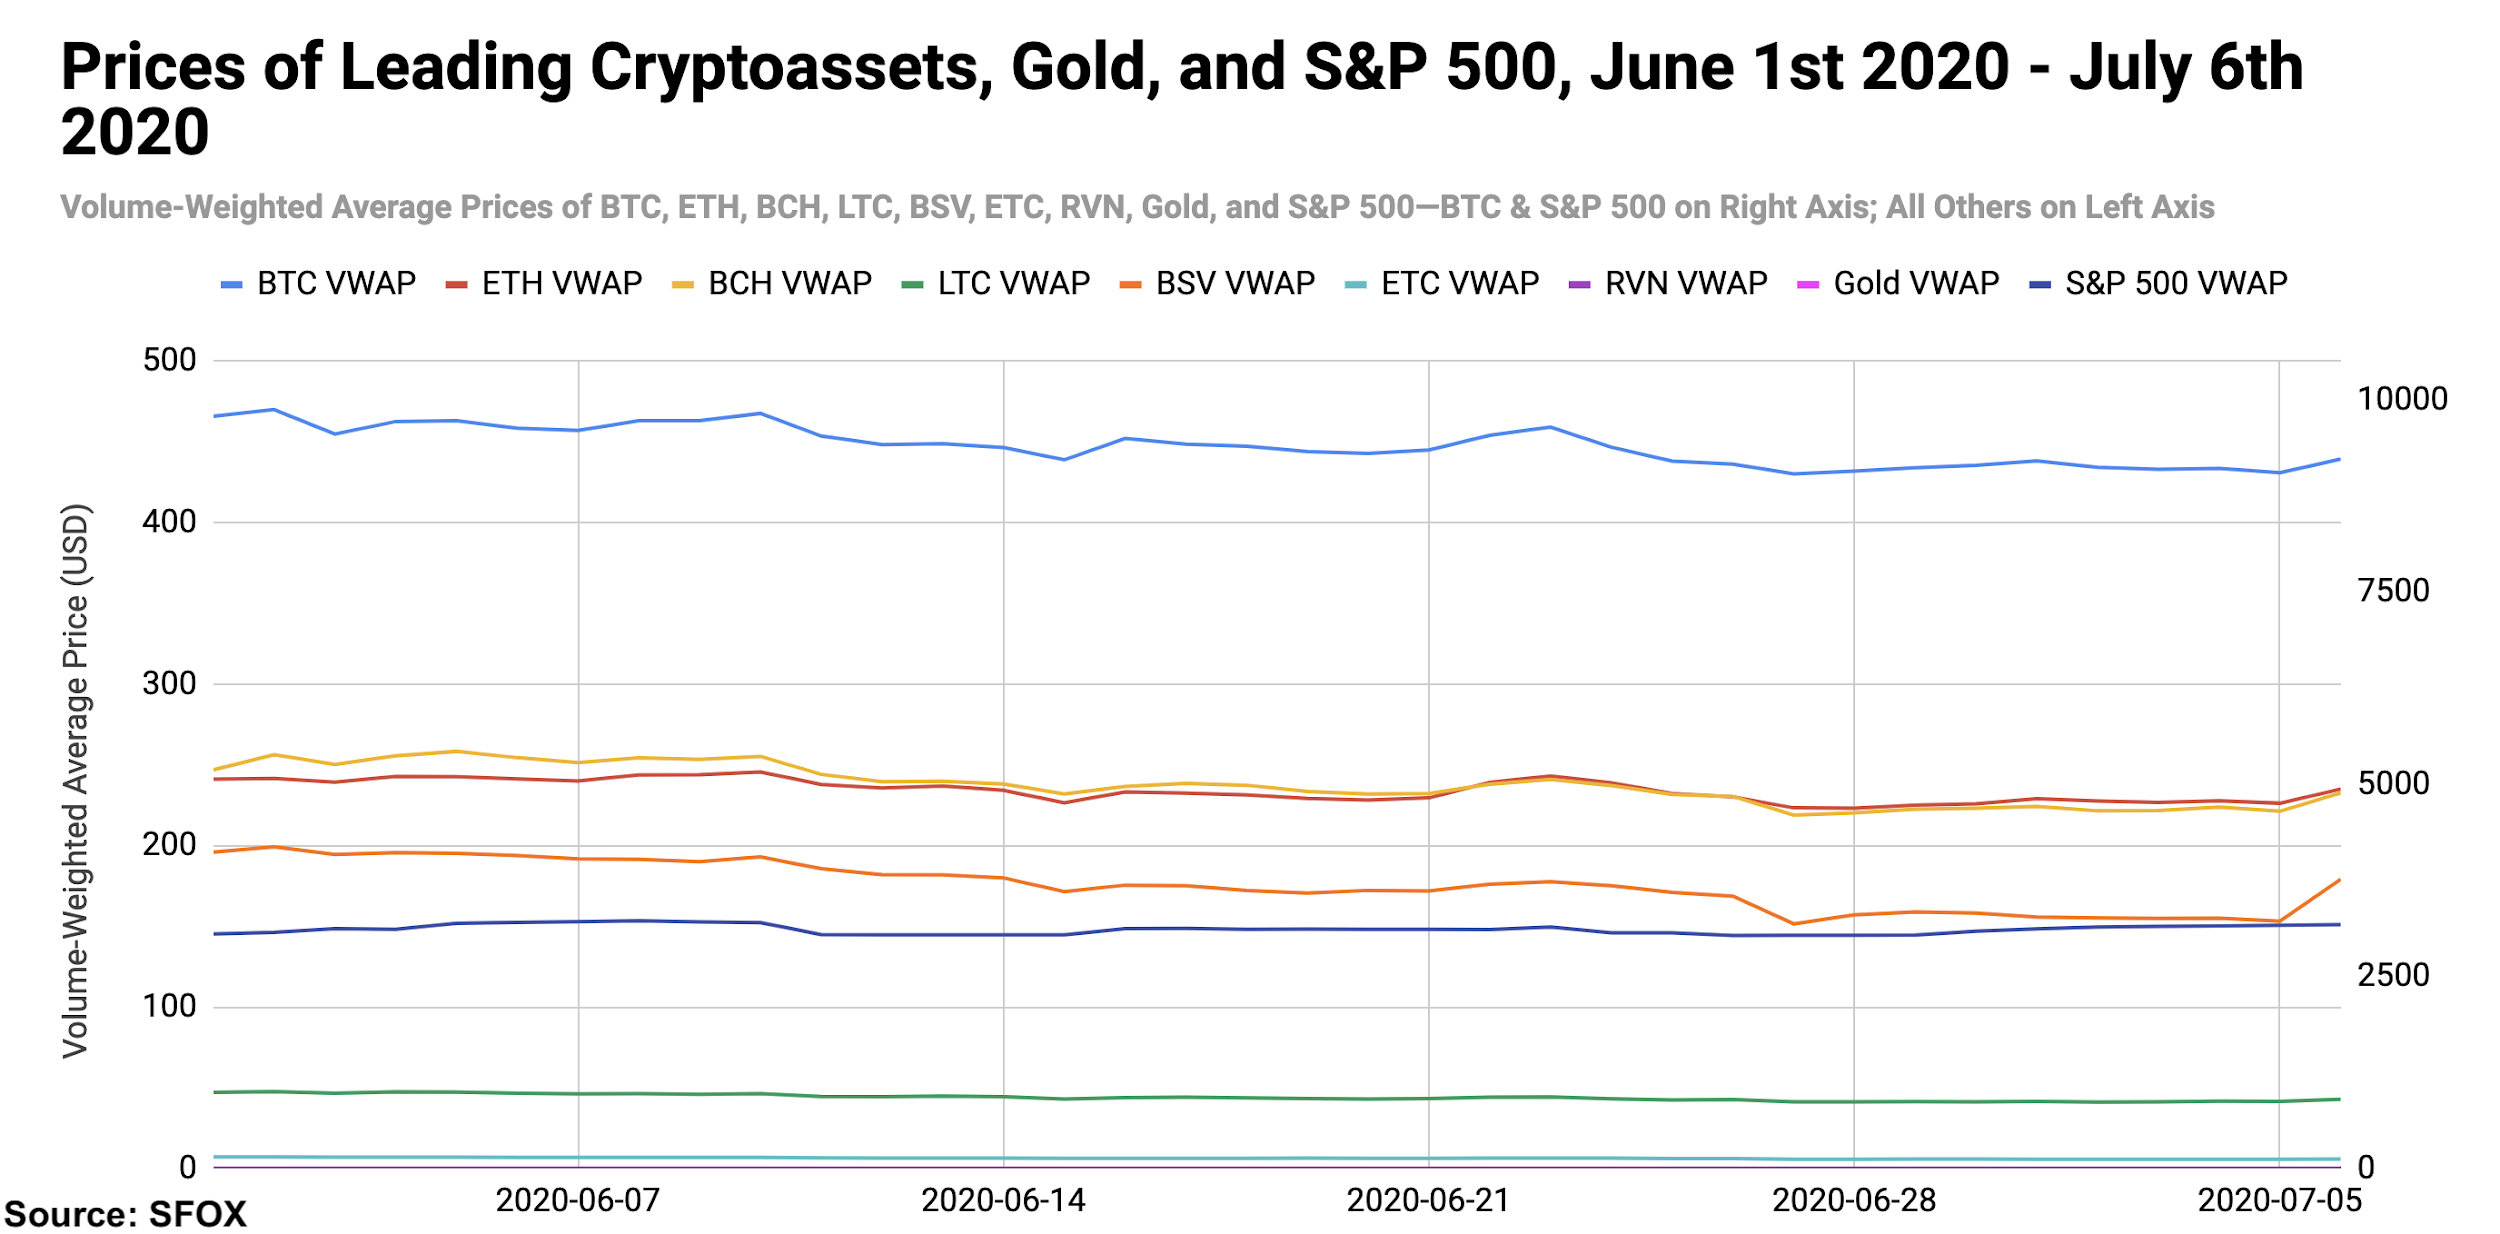
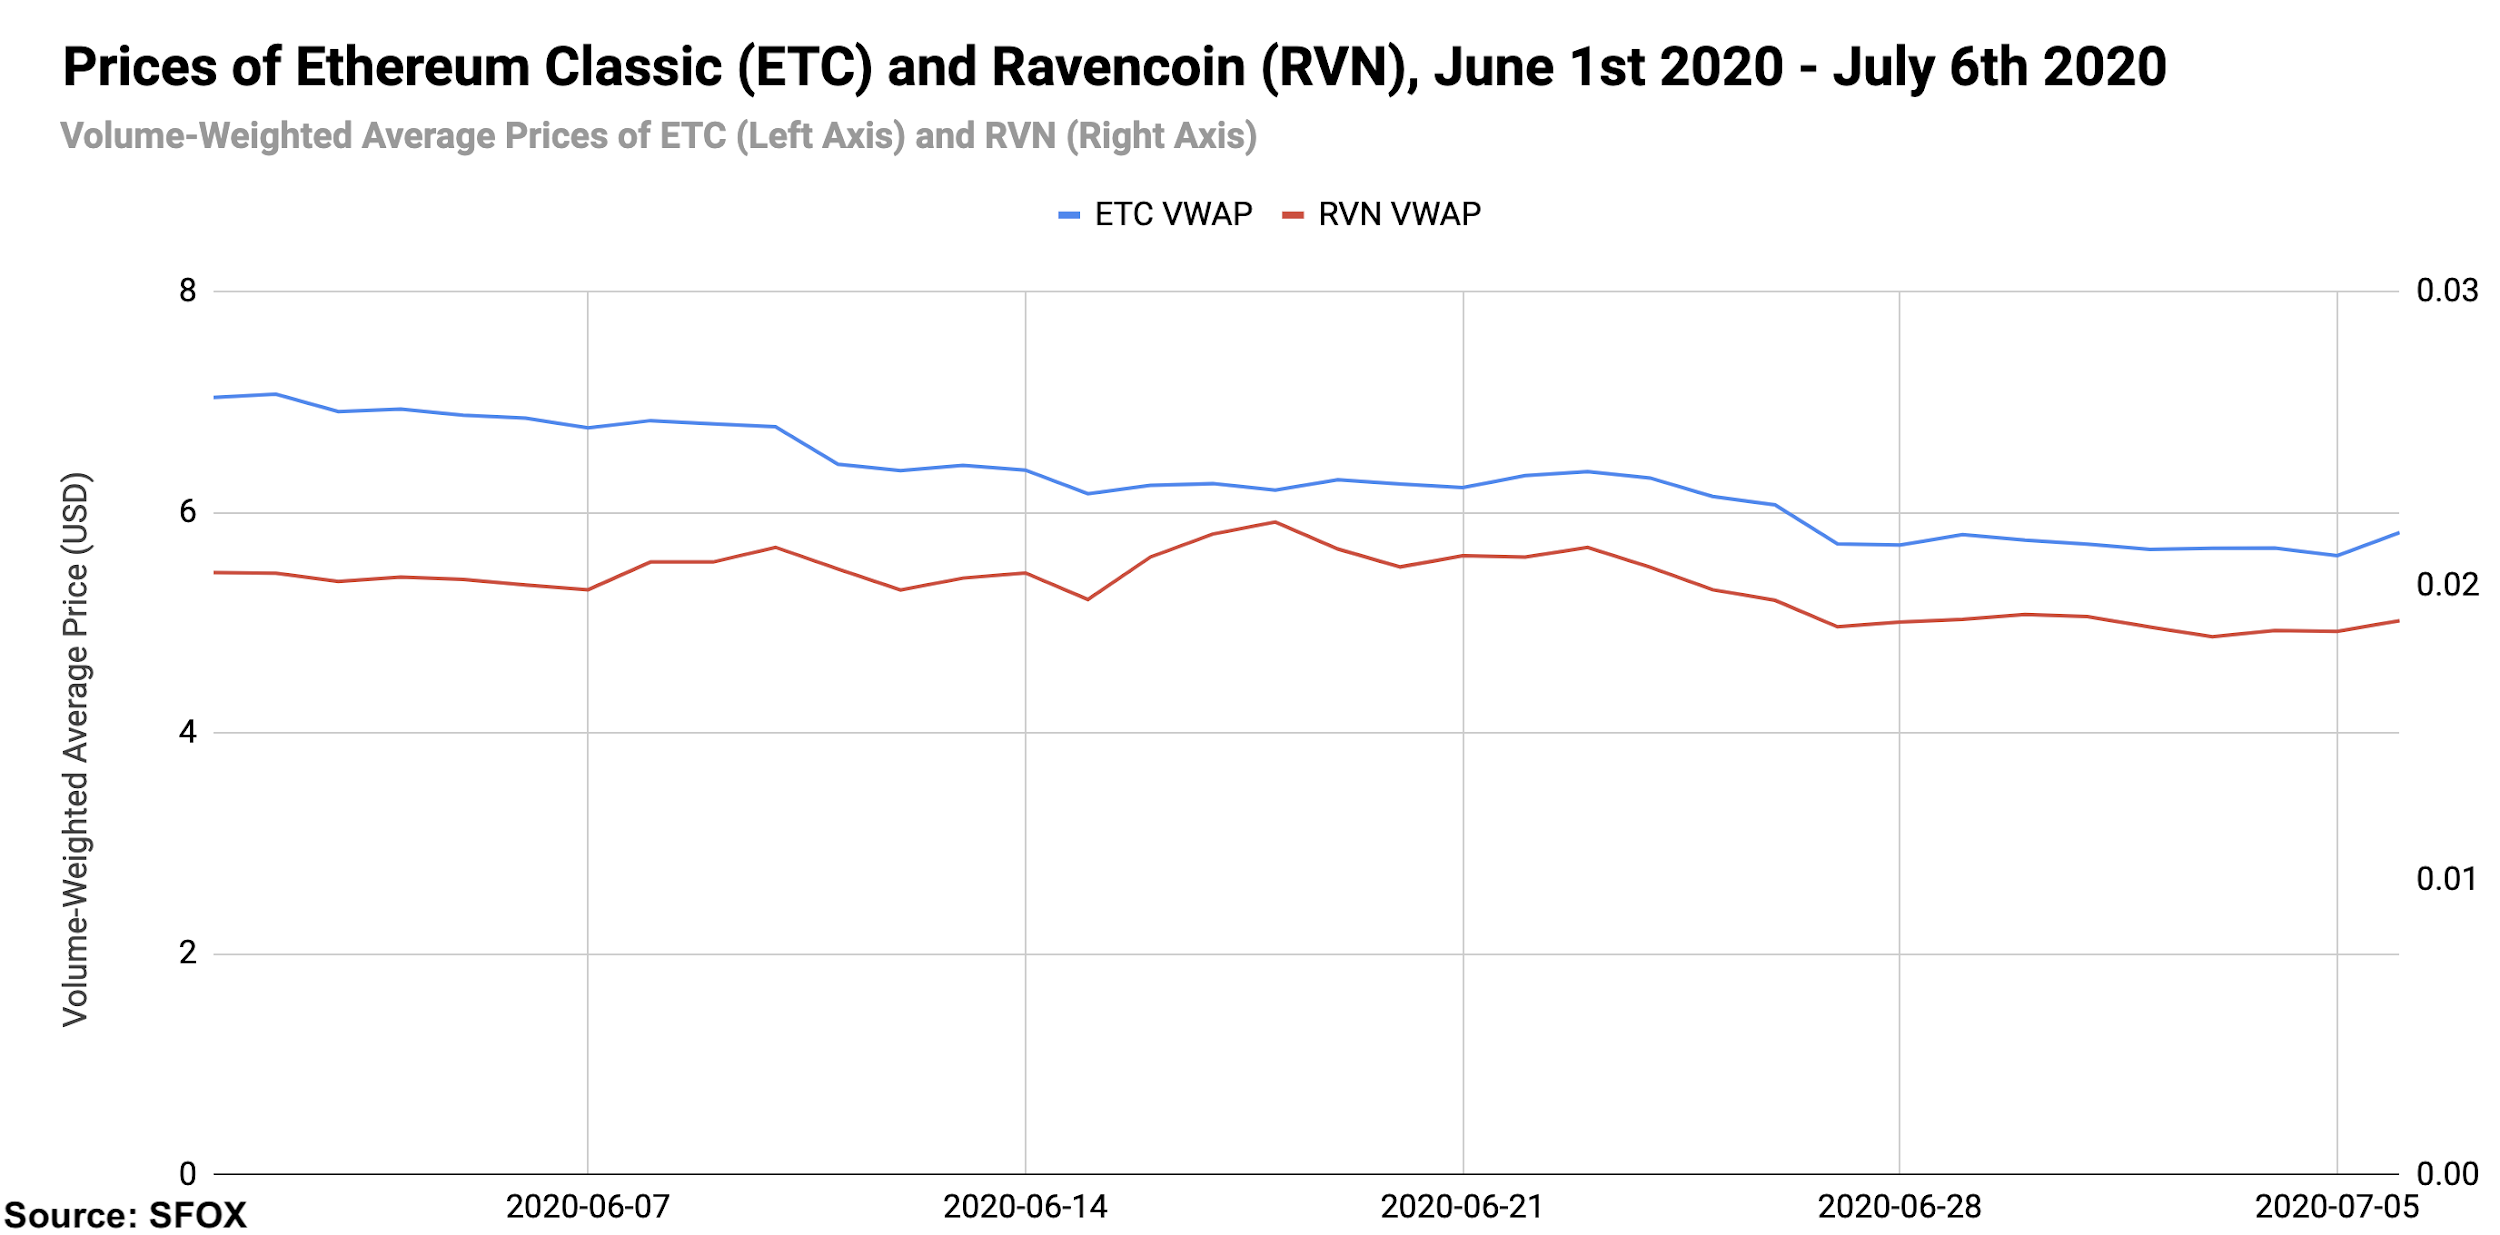
For better visibility of ETC and RVN price movements, please consult the following graph:
In a period when many crypto assets were relatively flat, the outlier both in terms of daily gains and daily losses was BSV, which lost 10.18% on June 27th and gained 16.94% on July 6th. RVN was another outlier, gaining 7.38% on June 16th and losing 4.62% on June 27th.
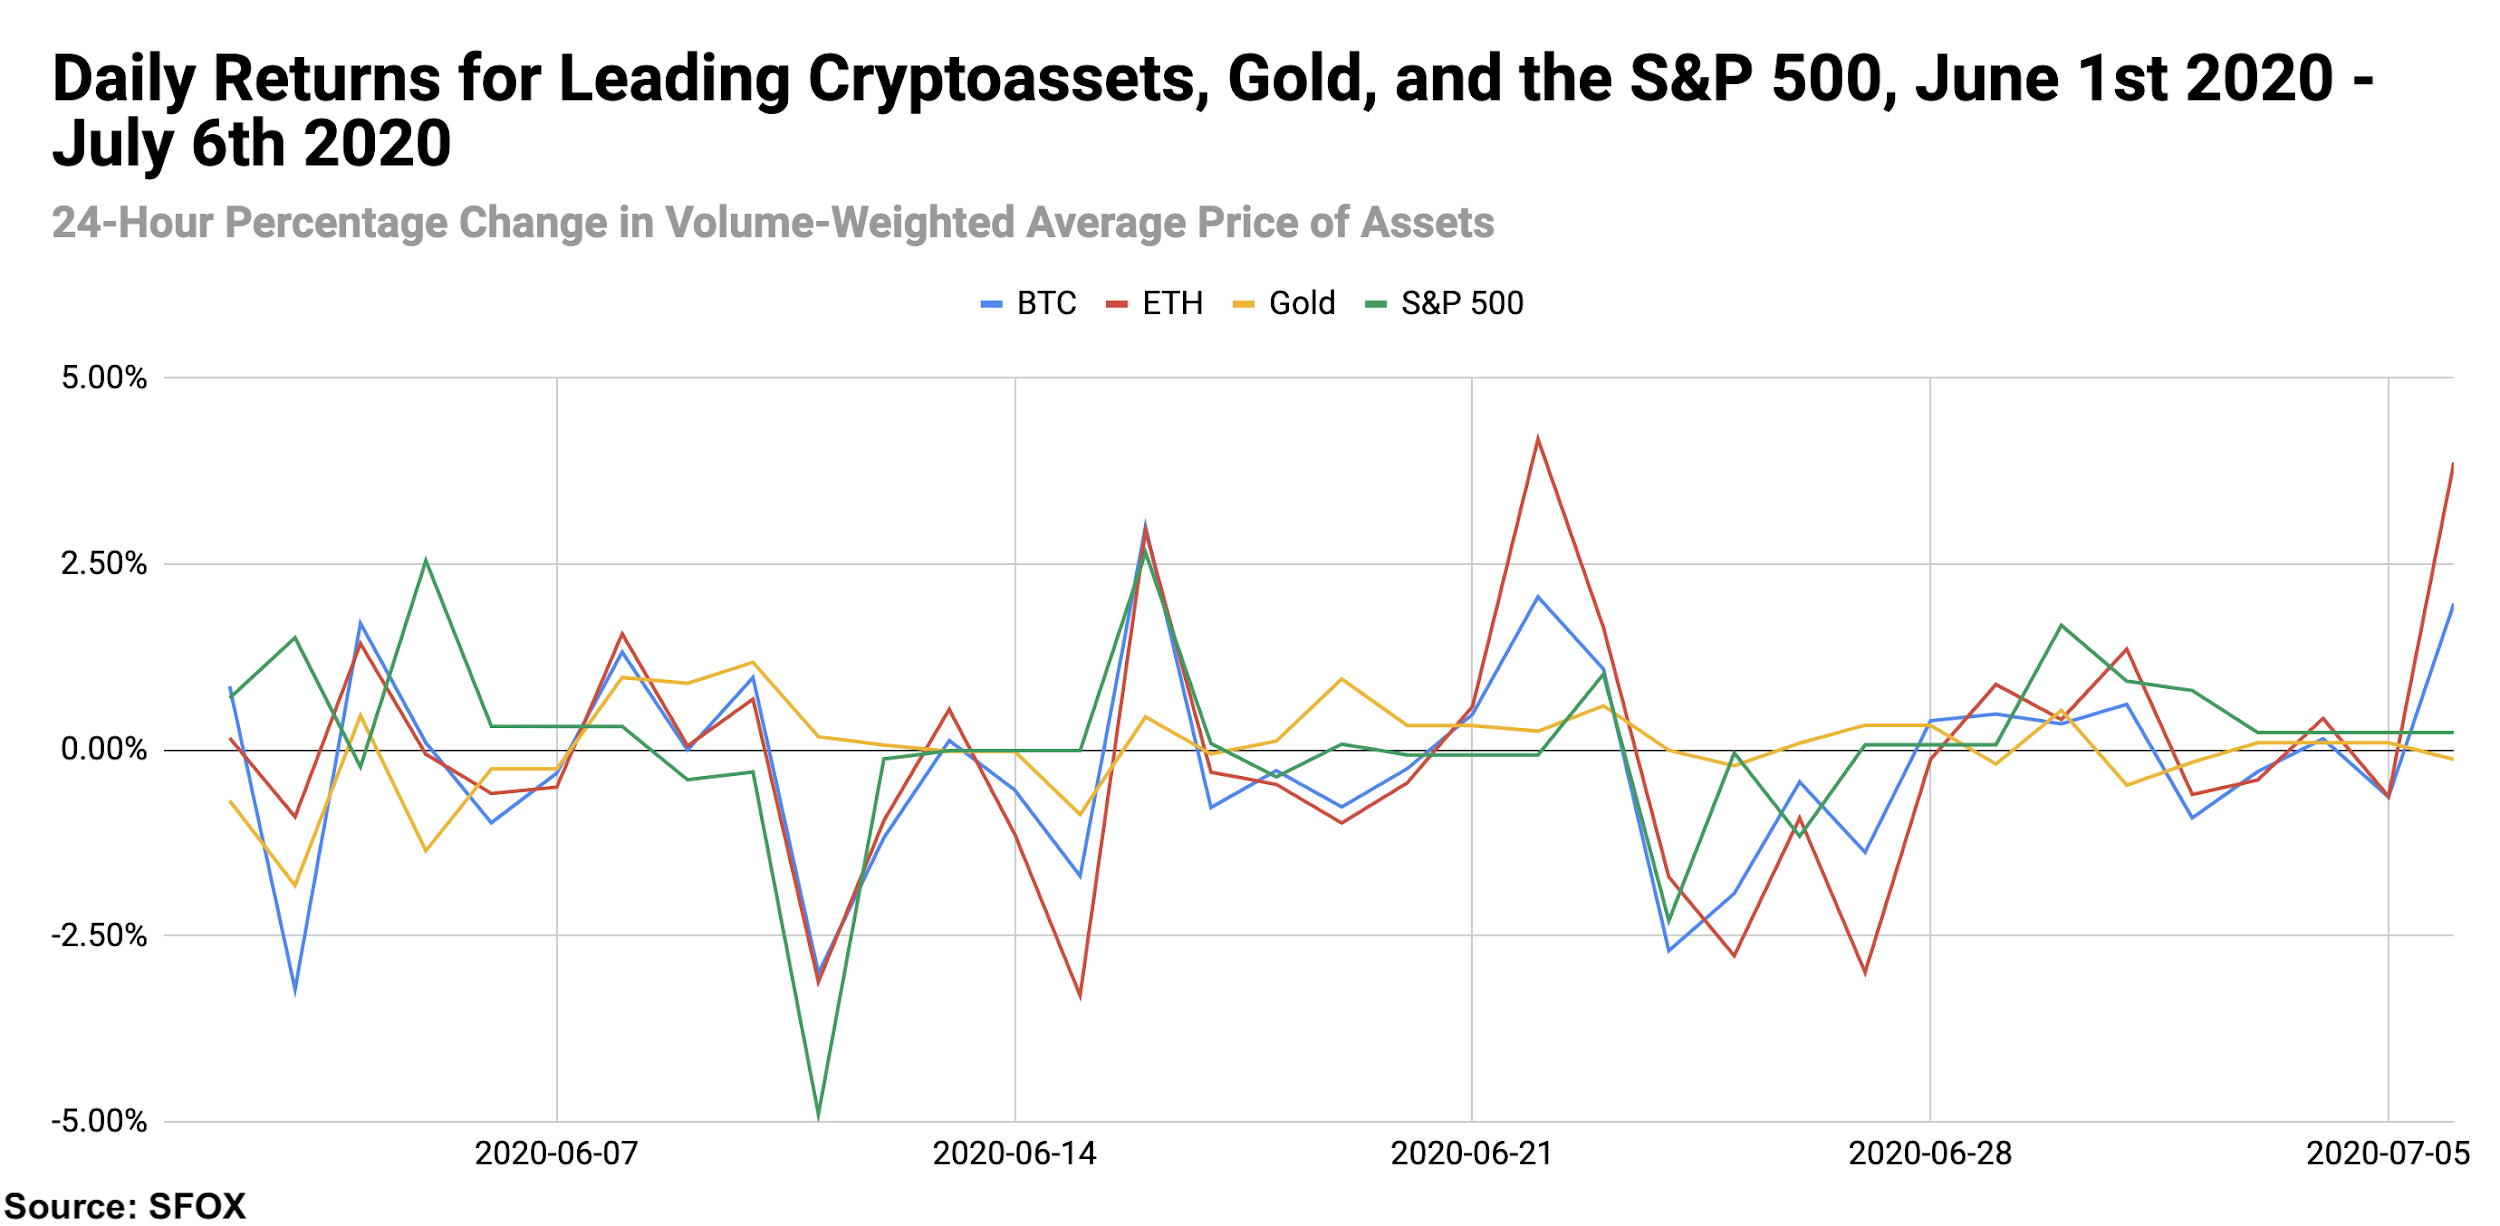
For greater graphical clarity, see this additional chart tracking only the daily returns of BTC, ETH, gold, and the S&P 500:
BTC, ETH, BCH, LTC, BSV, ETC, and RVN all showed month-over-month losses as of July 6th. Among those assets, ETH—which showed the highest month-over-month gains in this asset group in the previous two months—showed the smallest losses (-3.13%), while ETC showed the greatest losses (-15.44%). Gold was up 5.42% month-over-month, and the S&P 500 was relatively flat at -0.63% month-over-month losses.
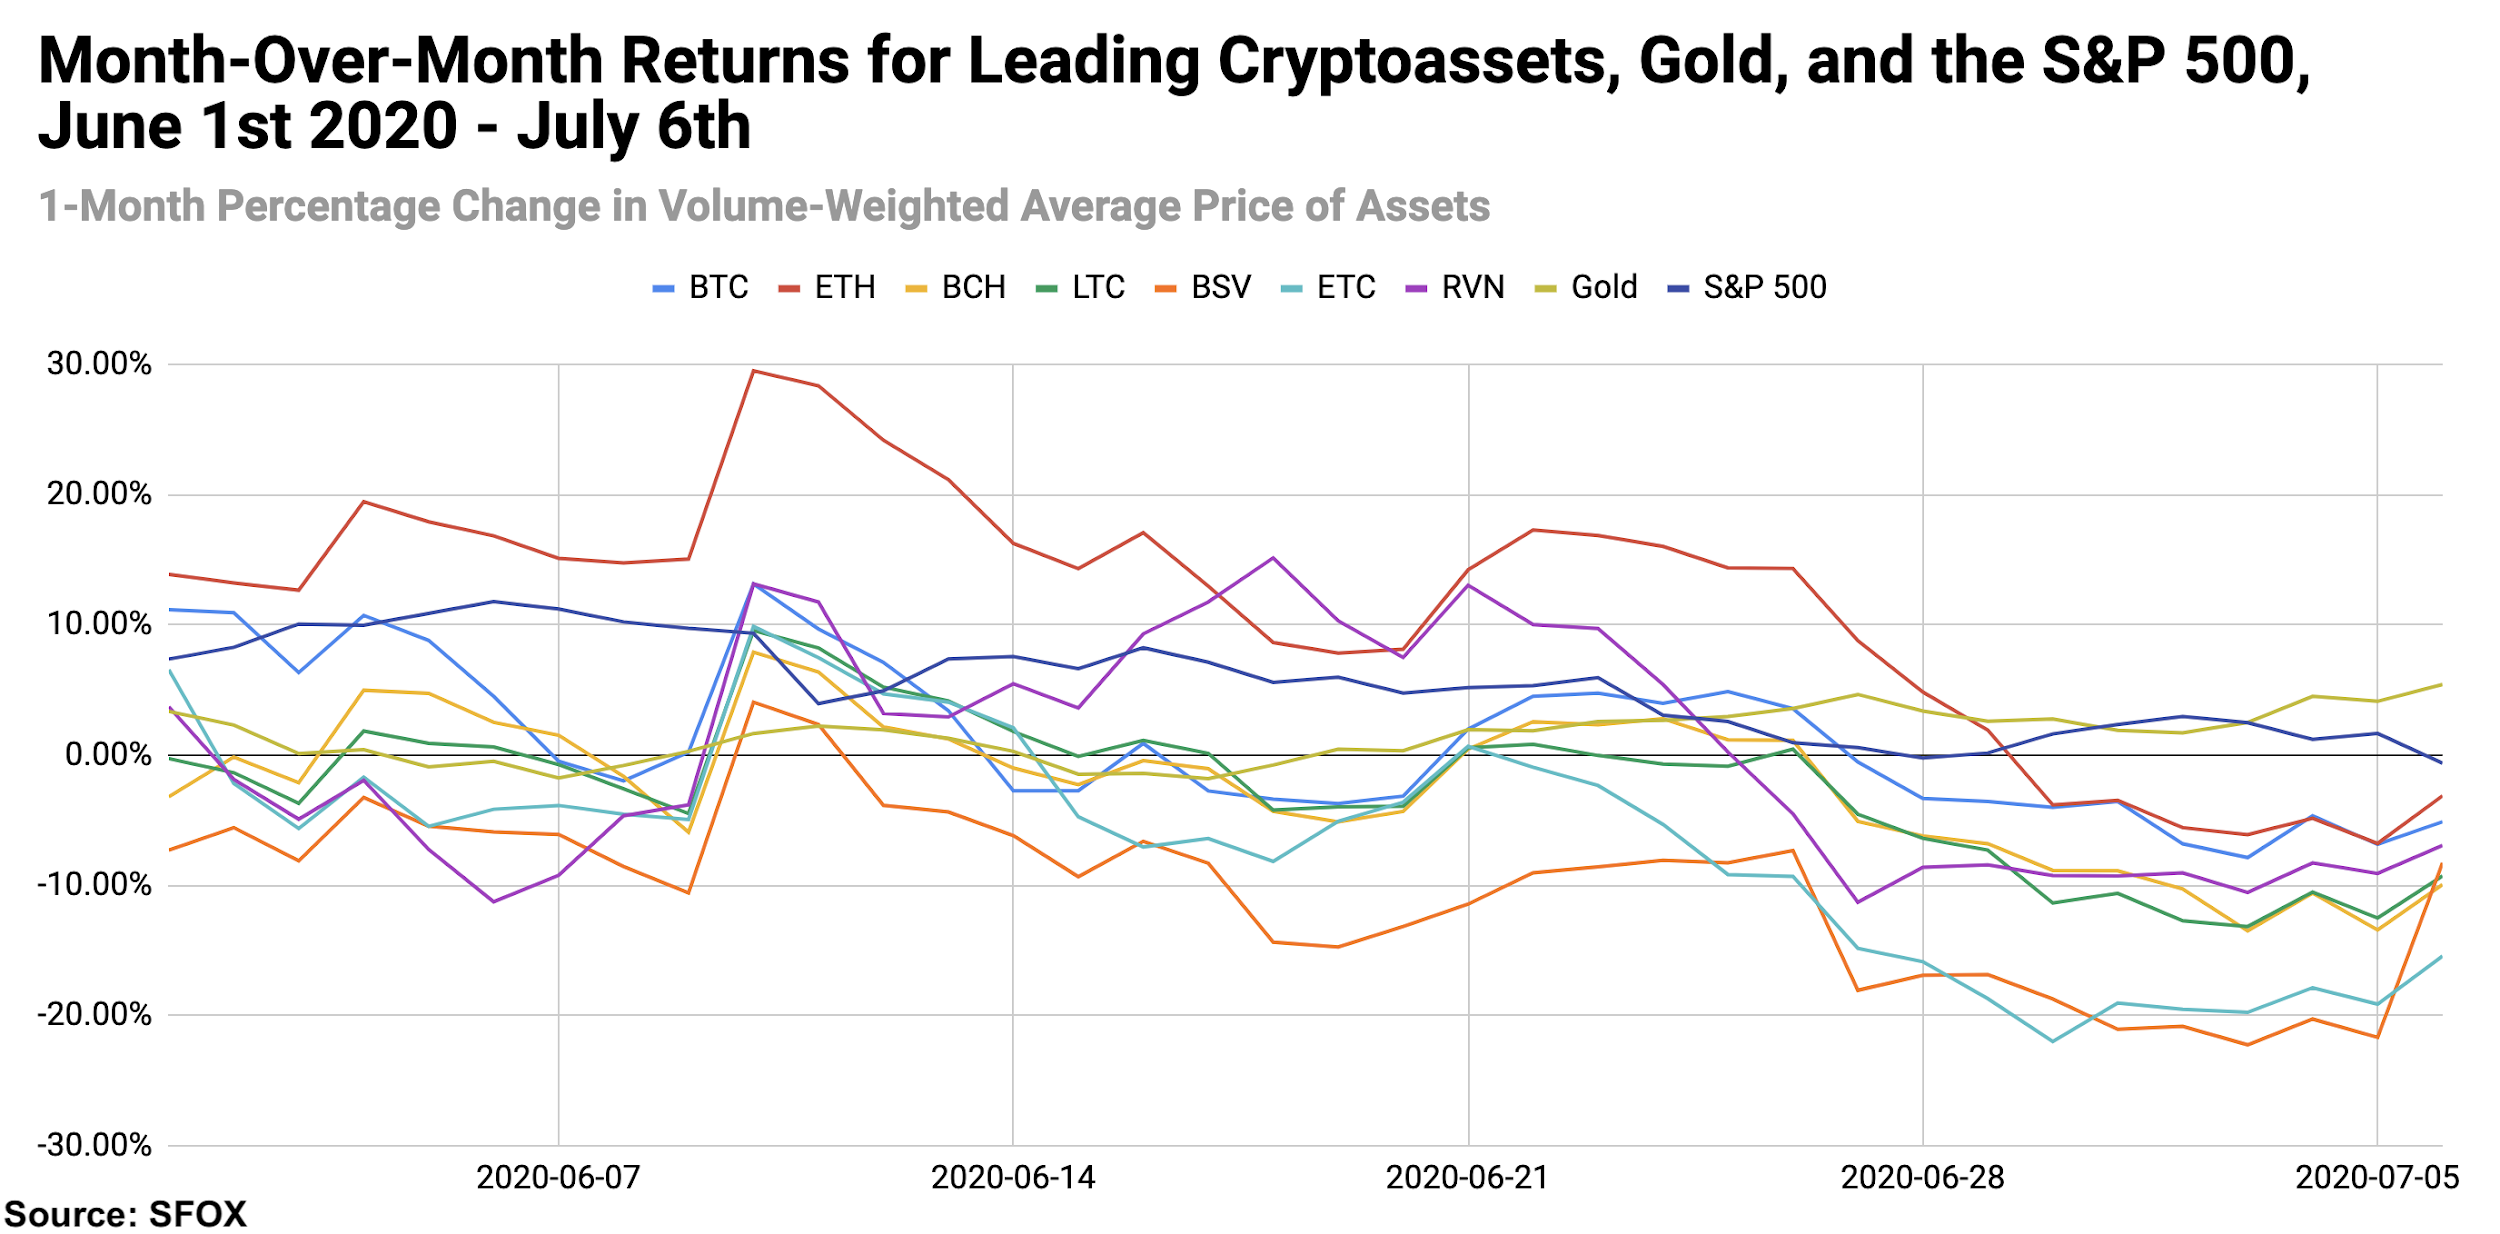
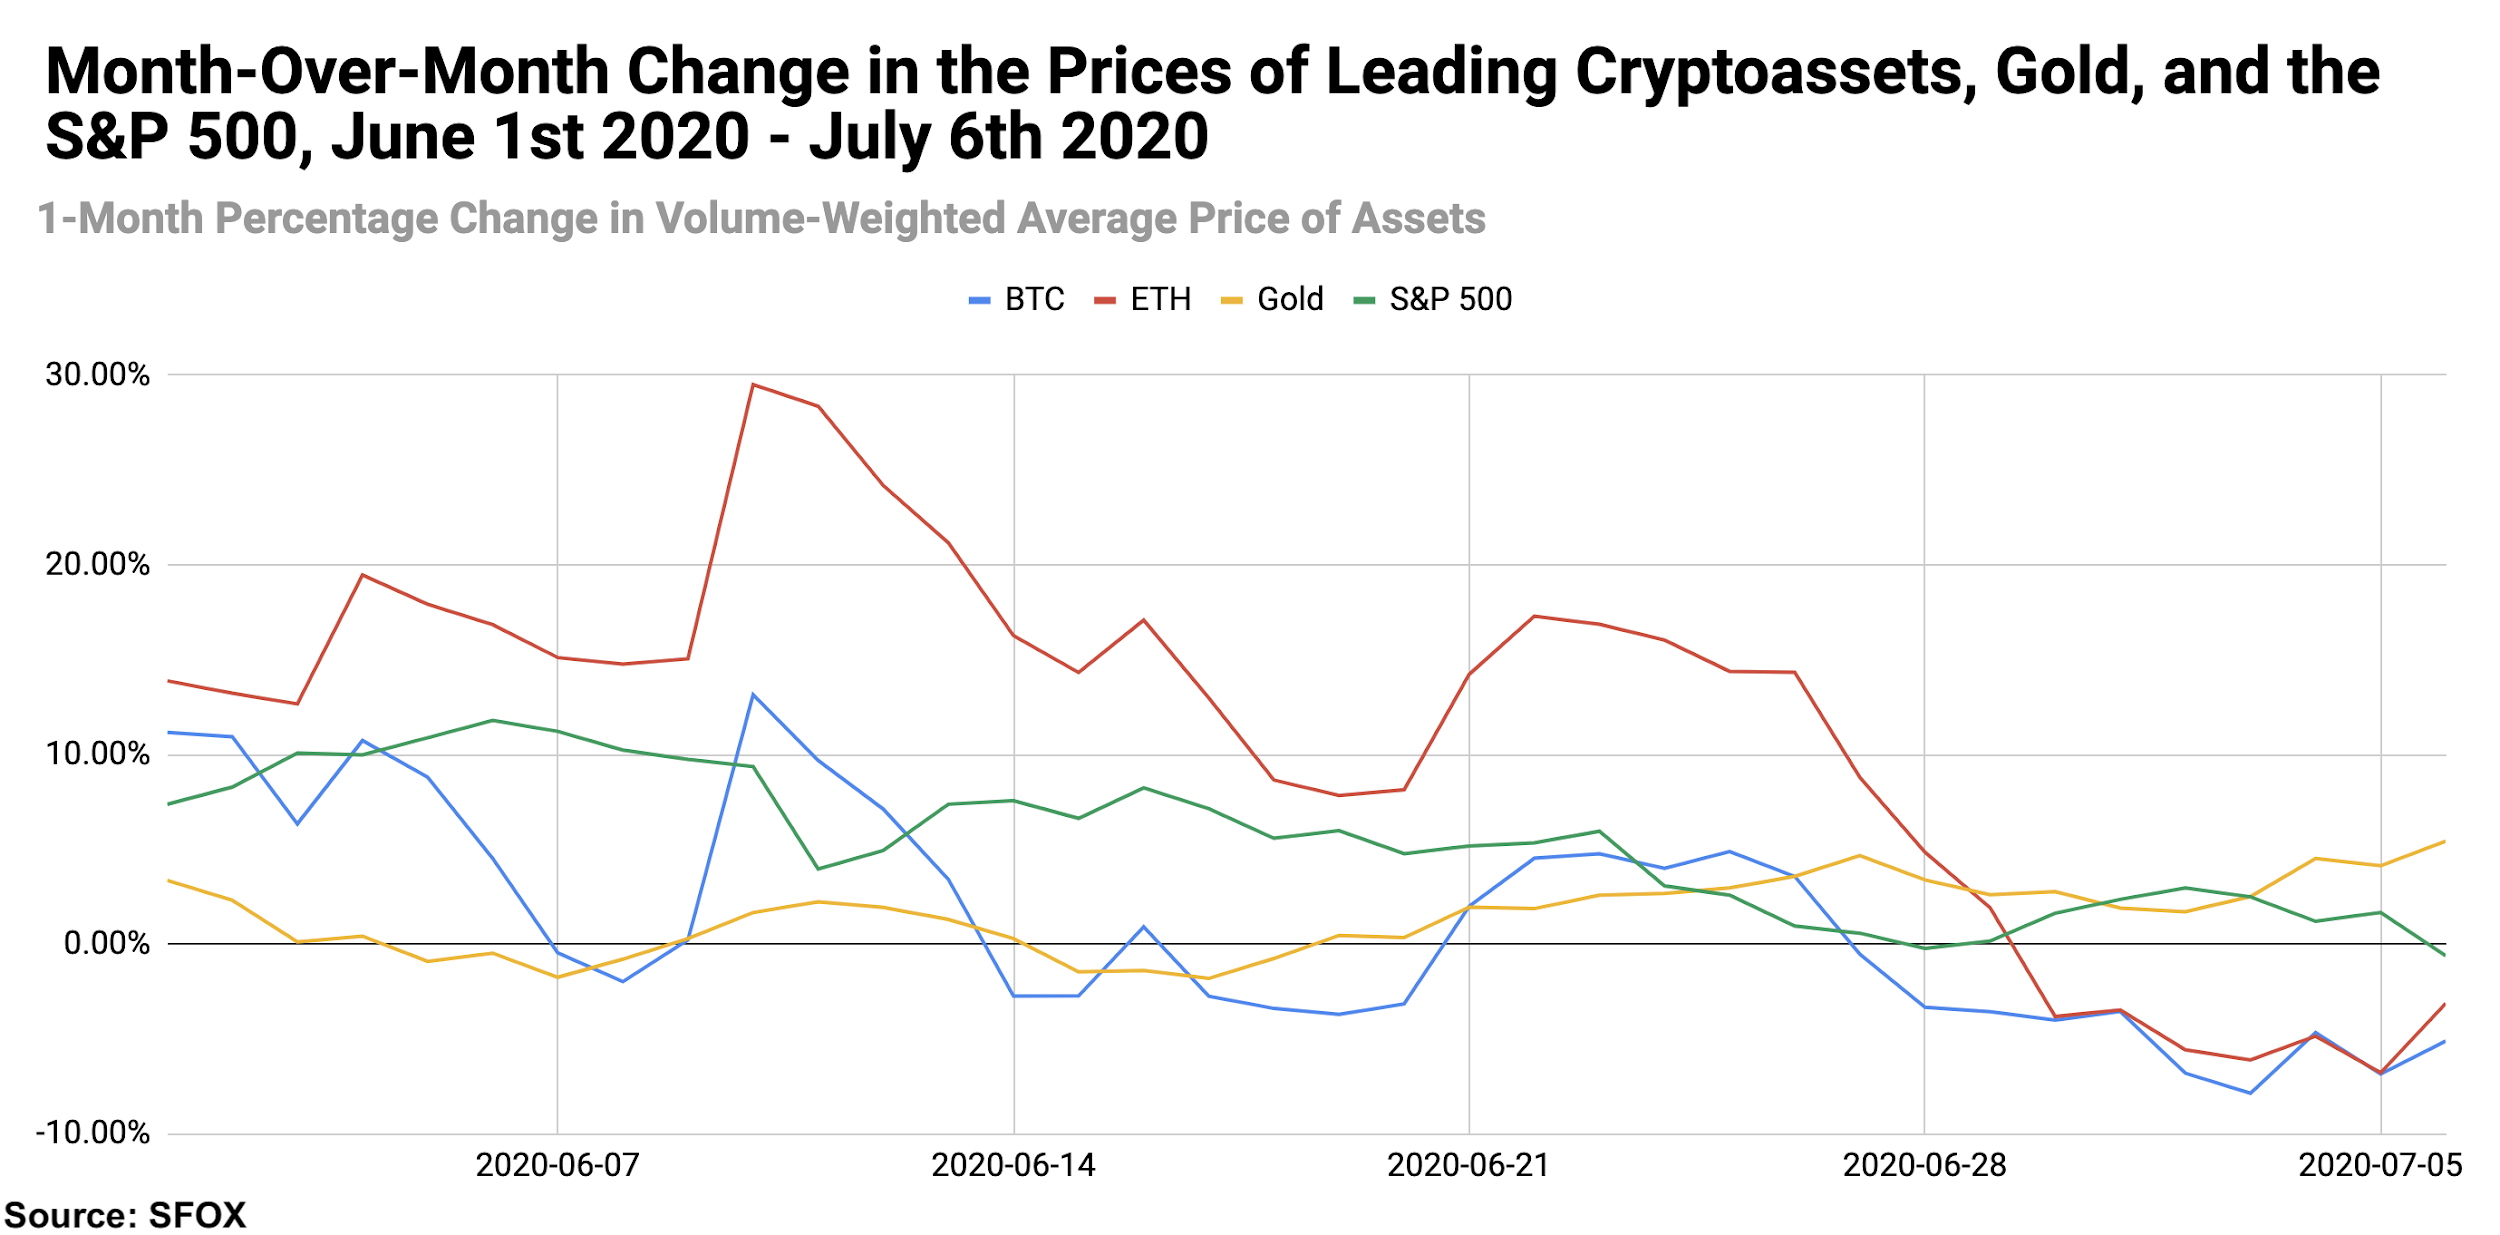
For greater graphical clarity, see this additional chart tracking only the month-over-month changes in the prices of BTC, ETH, gold, and the S&P 500:
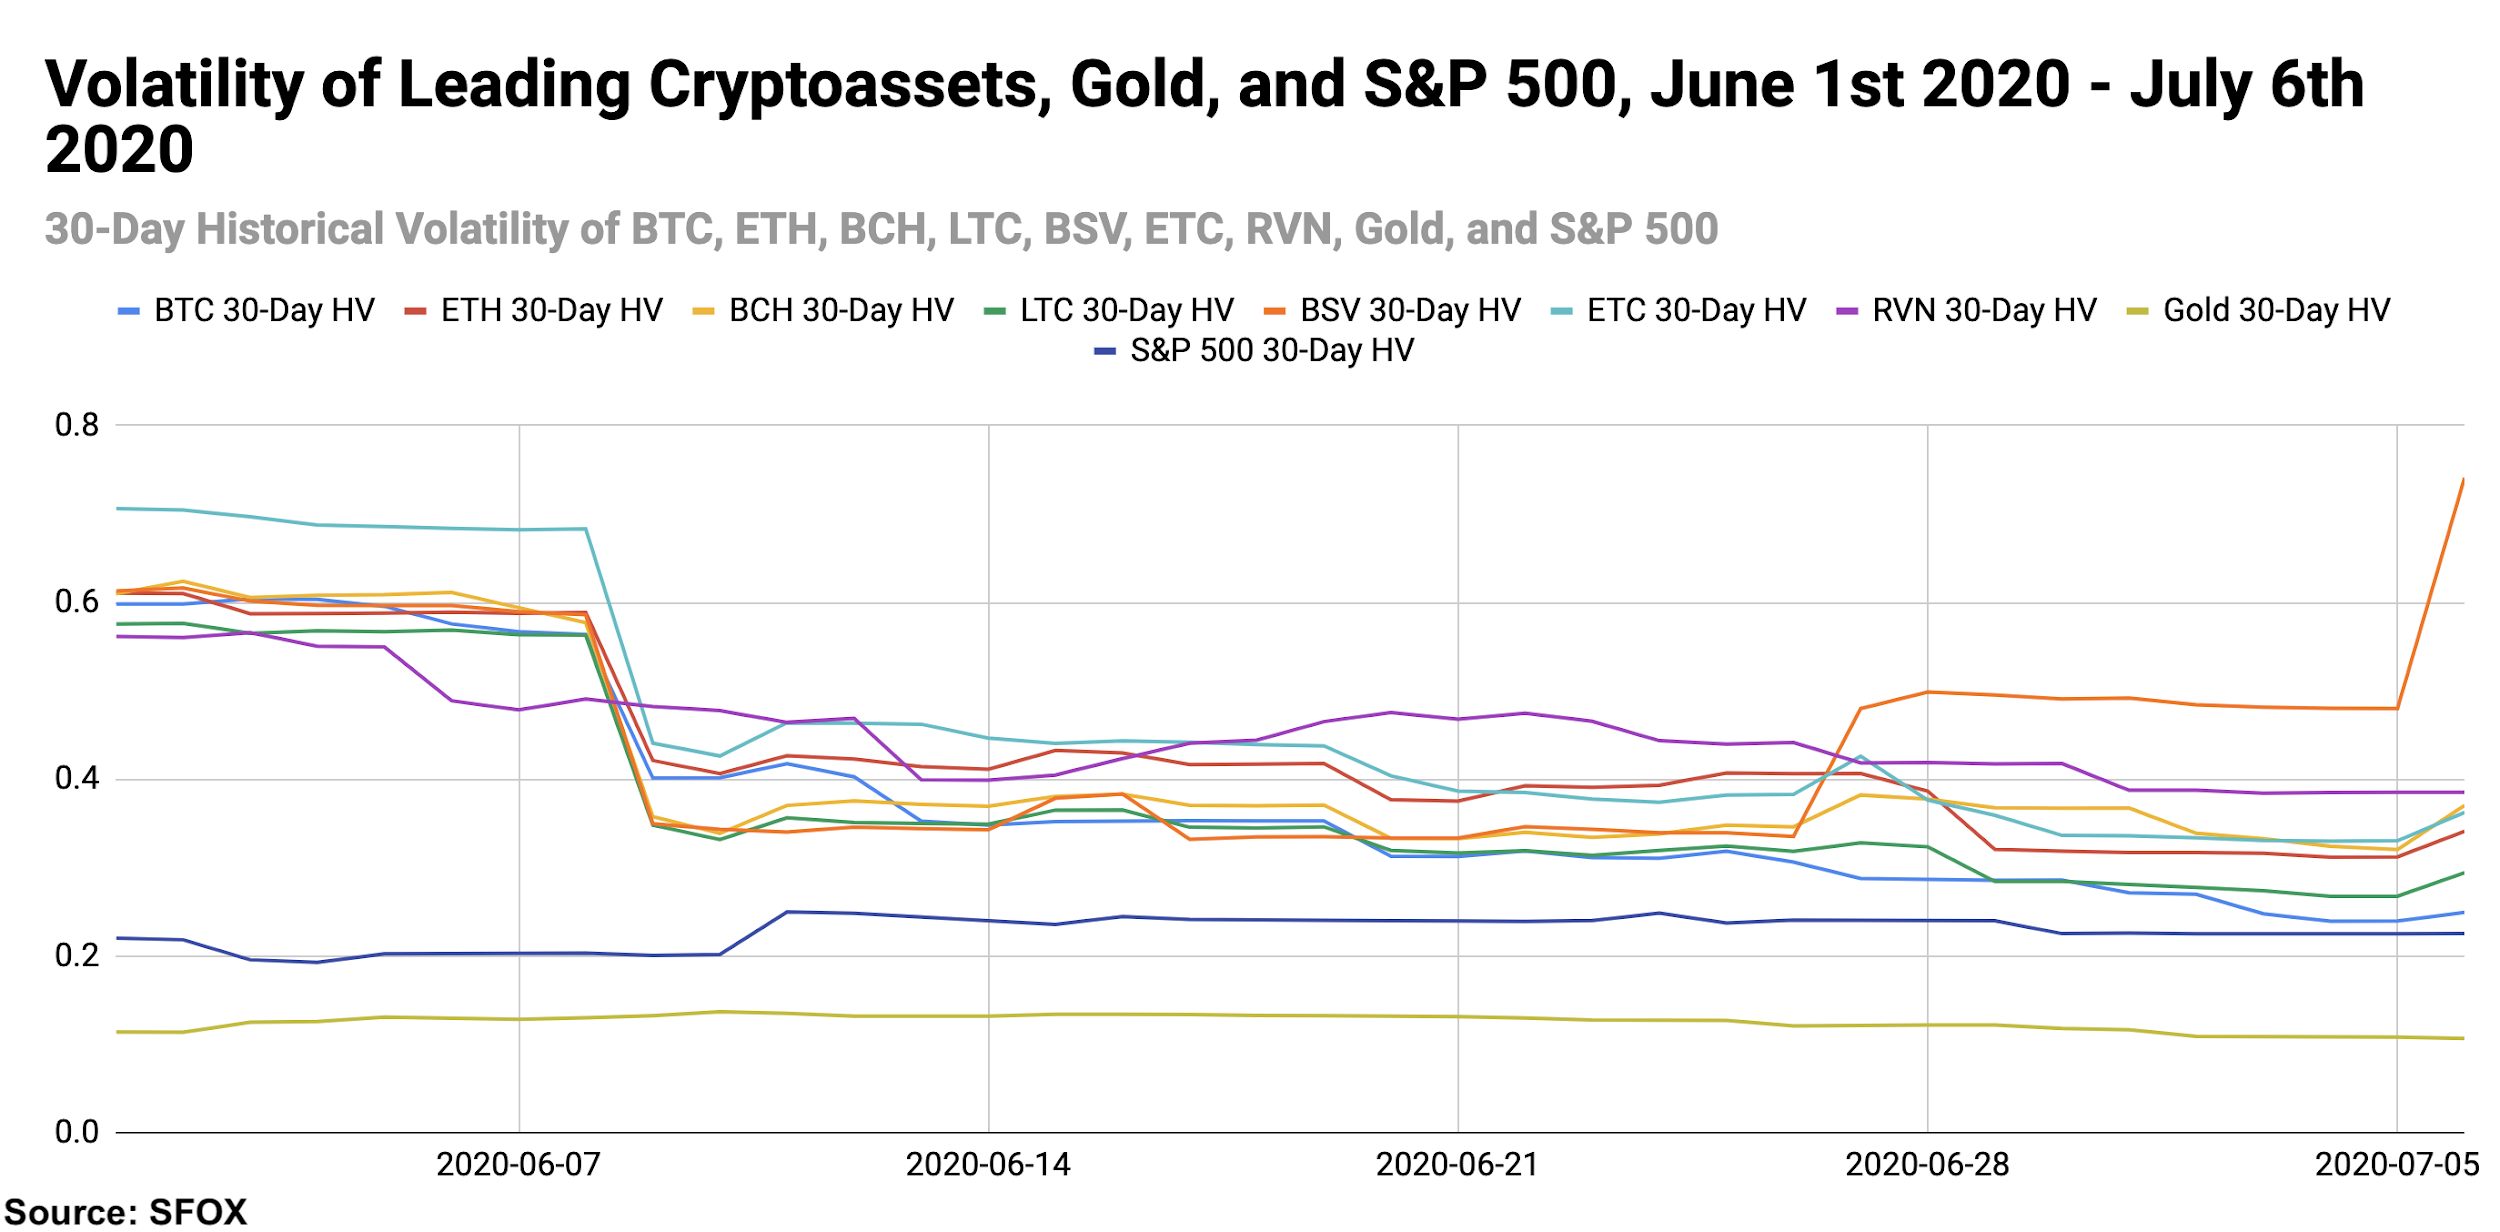
Volatility: Trending Downward
Bitcoin’s volatility, along with the volatility of most other major crypto assets, has decreased in the last month, going from 59.84% on June 1st to 24.94% on July 6th. The outlier in crypto volatility was BSV, which followed the general downward trend before climbing to 74.11% on July 6th.
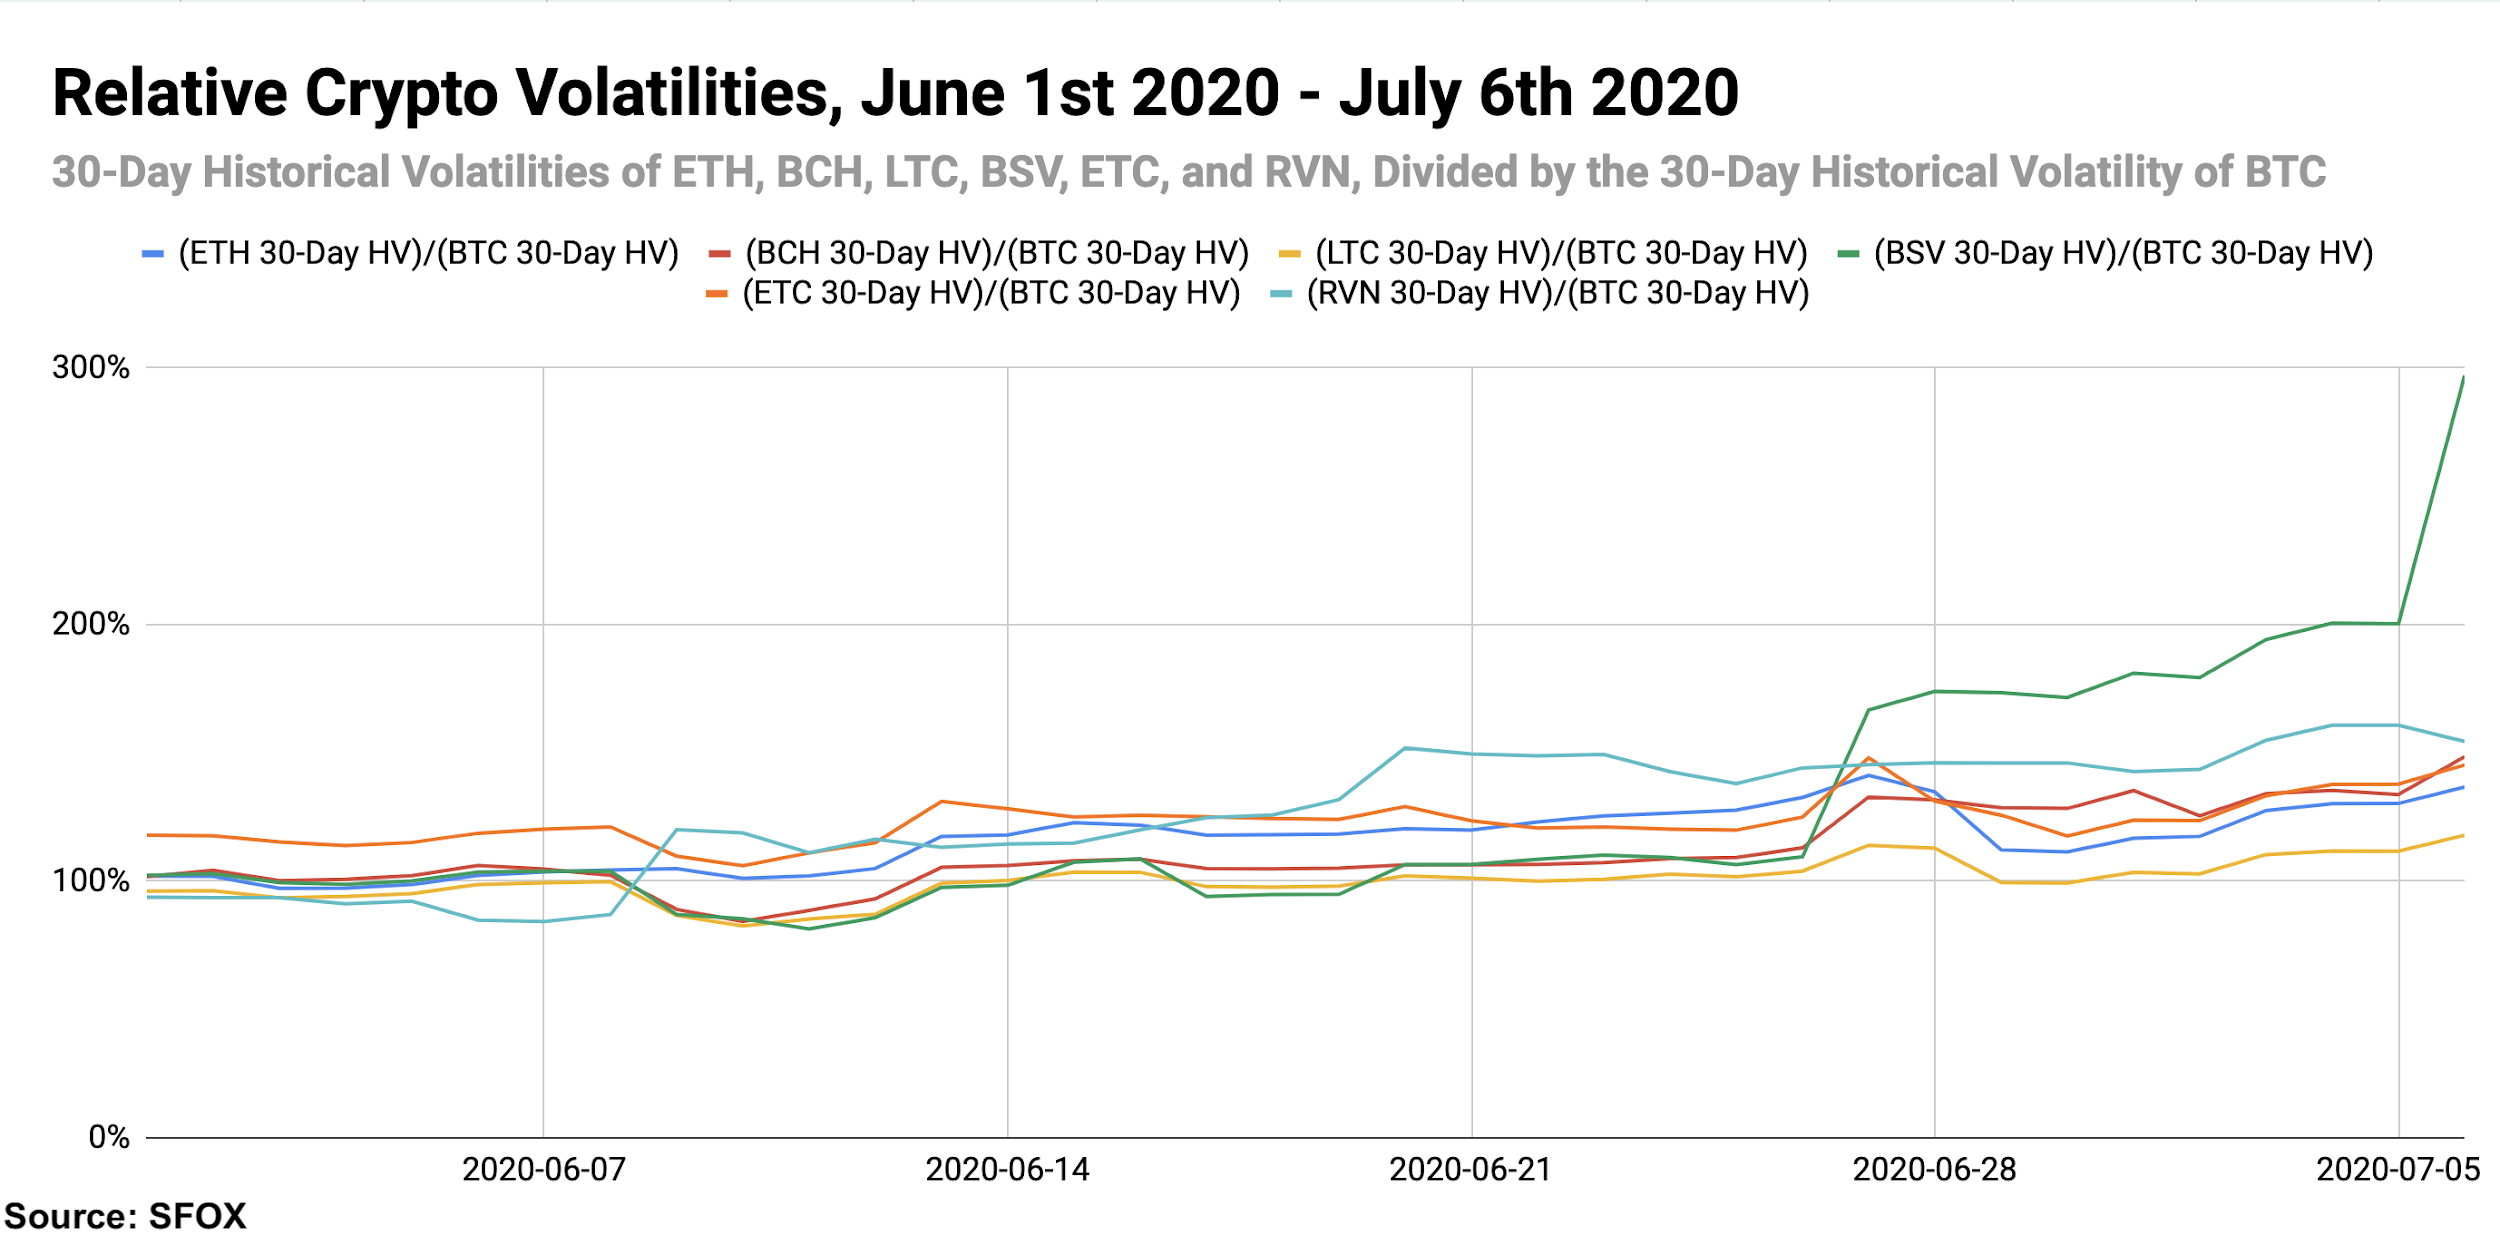
By looking at the 30-day historical volatilities of ETH, BCH, LTC, BSV, ETC, and RVN as a percentage of BTC’s 30-day historical volatility, we can see that altcoins’ volatilities remained fairly aligned with that of BTC over the course of the month—again, with the exception of BSV’s performance at the beginning of July.
Price Correlations: Follow the Leader
As we discussed above, the key observation to make in the latest crypto correlations is that BTC remains highly correlated with major altcoins, despite some commenters claiming that altcoins are decoupling from BTC.
See the full SFOX crypto correlations matrix below:
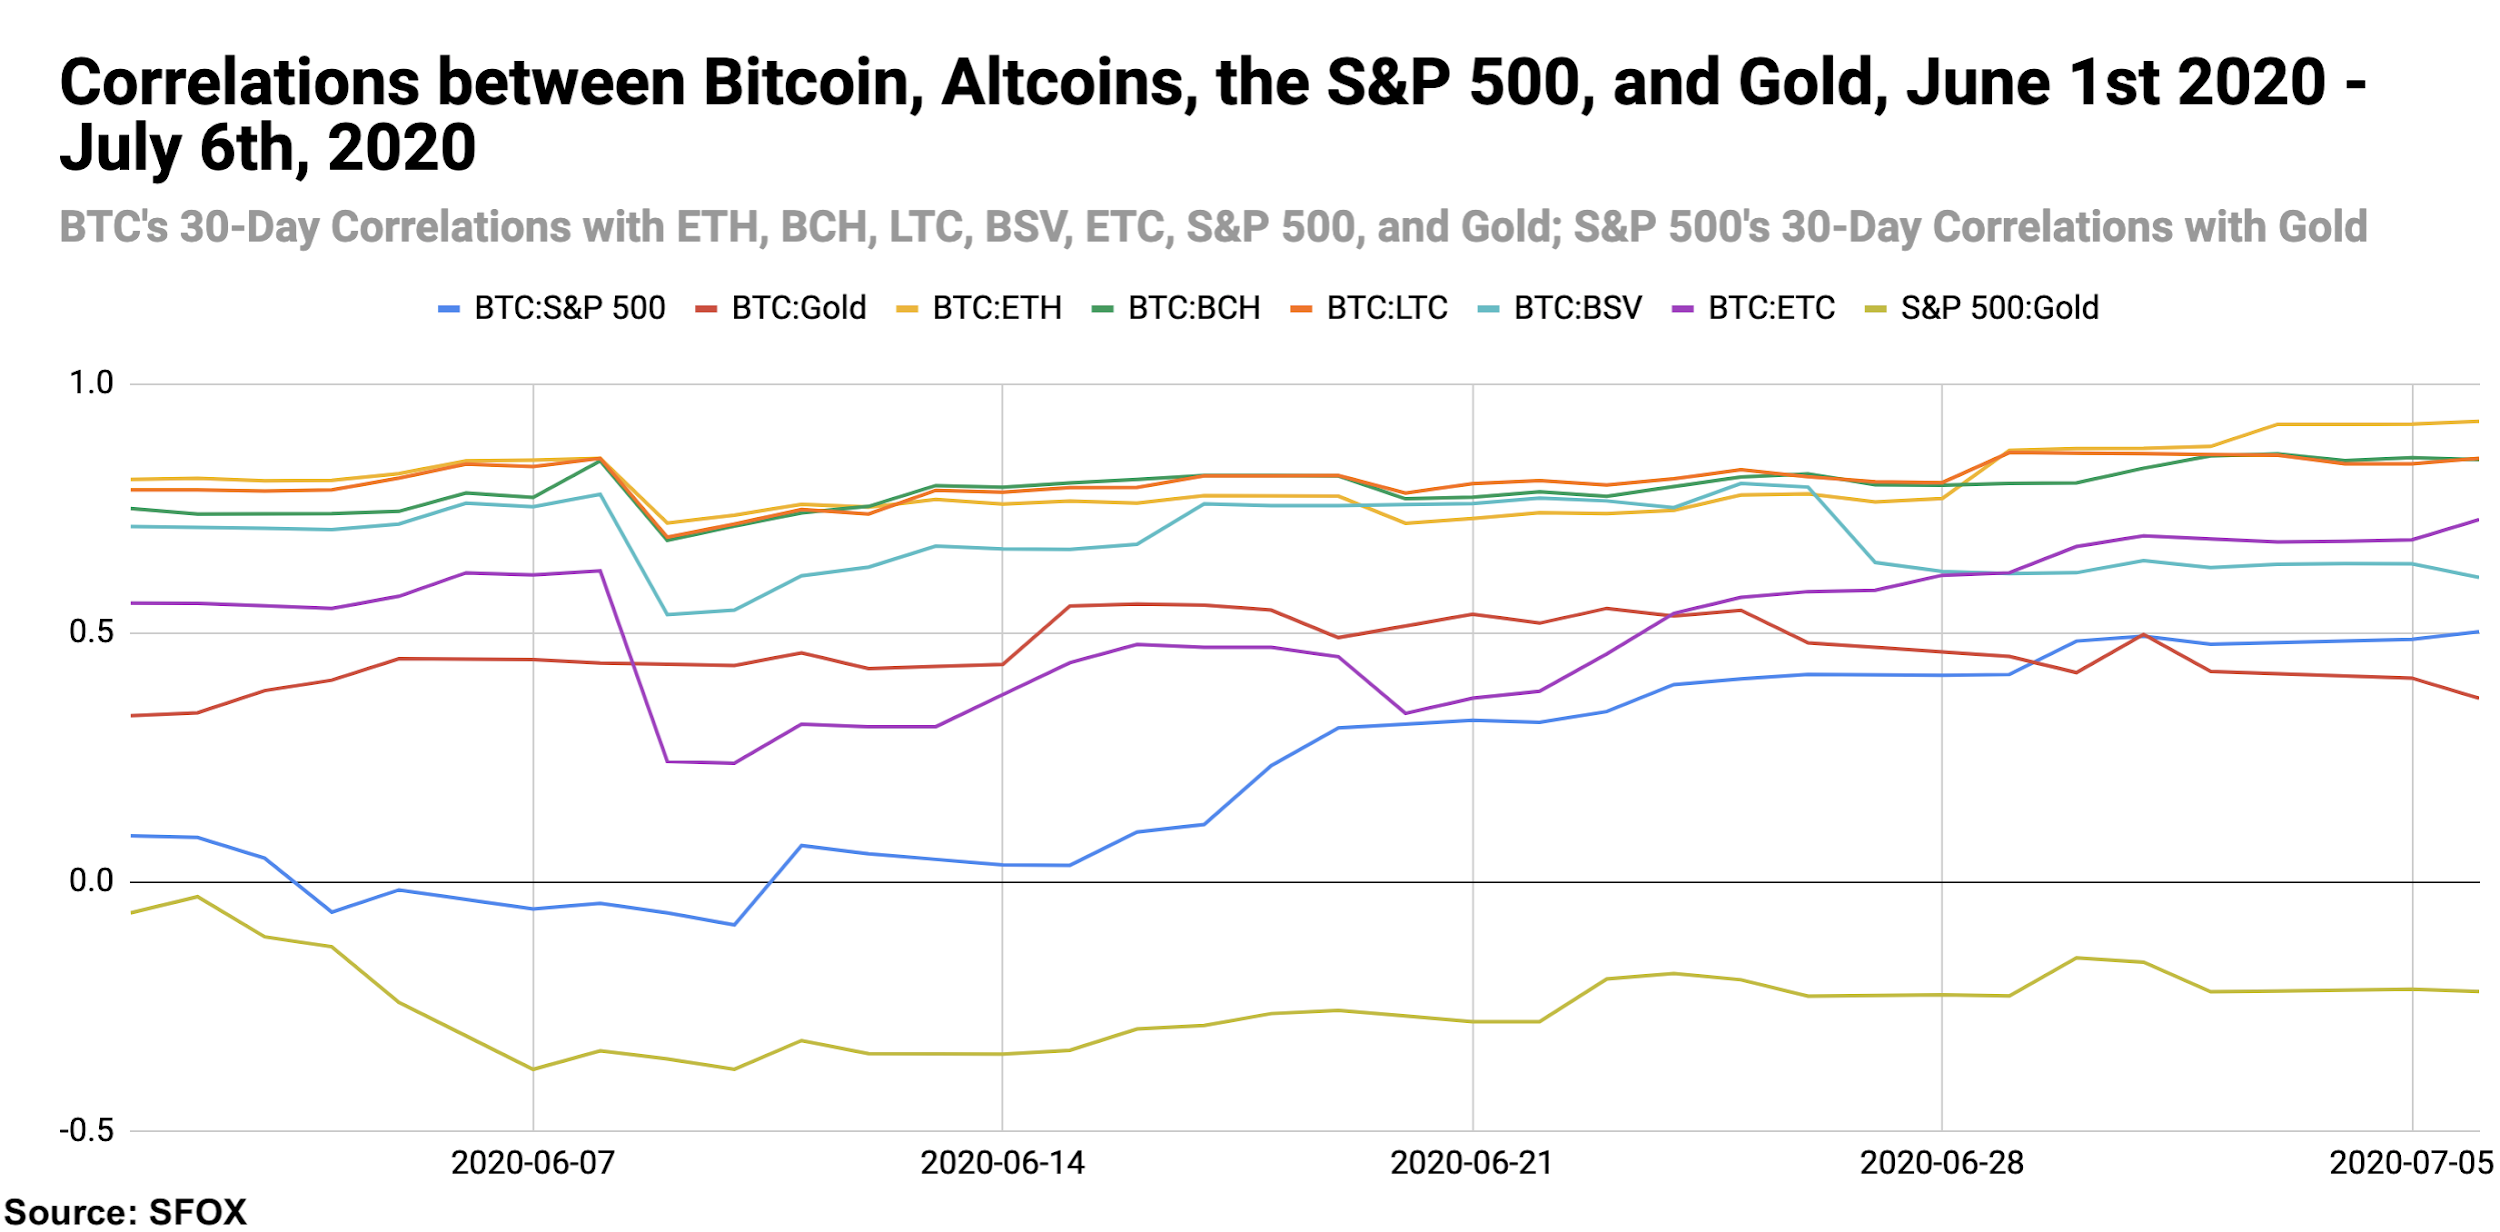
For a more complete look at BTC’s correlations with other assets throughout the past month, see the following graph:
Appendix: Data Sources, Definitions, and Methodology
All cryptocurrency prices are denominated in USD unless otherwise noted.
Note that data collection for RVN began on February 2nd of this year, which is why RVN is not yet featured in all data analyses. RVN is also denominated in USD for ease of analysis and comparison with other crypto assets, though most RVN trading currently happens in the RVN/BTC pair.
We use two different in-house volatility indices in creating these reports:
1. 30-day historical volatility (HV) indices are calculated from daily snapshots over the relevant 30-day period using the formula:
30-Day HV Index = σ(Ln(P1/P0), Ln(P2/P1), …, Ln(P30/P29)) * √(365)
2. Daily historical volatility (HV) indices are calculated from 1440 snapshots over the relevant 24-hour period using the formula:
Daily HV Index = σ(Ln(P1/P0), Ln(P2/P1), …, Ln(P1440/P1439))* √(1440)
S&P 500 performance data are collected from Yahoo! Finance using GSPC (S&P 500 Index) data. Gold performance data are collected from Yahoo! Finance using GC=F data.
30-day asset correlations are calculated using the Pearson method, in accordance with the following formula:
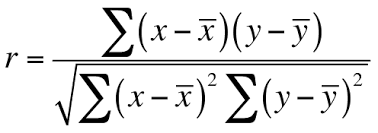
In our calculations, x = 30-day returns for BTC/USD, y = 30-day returns for the other asset in consideration, and r = the correlation coefficient between BTC and the other asset in consideration.
The crypto asset data sources aggregated for crypto prices, correlations, and volatility indices presented and analyzed in this report are the following eight exchanges, the order-book data of which we collect and store in real time:
- bitFlyer
- Binance
- Bitstamp
- Bittrex
- Coinbase
- Gemini
- itBit
- Kraken
Our indices’ integration of data from multiple top liquidity providers offers a more holistic view of the crypto market’s minute-to-minute movement. There are two problems with looking to any single liquidity provider for marketwide data:
- Different liquidity providers experience widely varying trade volumes. For example: according to CoinMarketCap, Binance saw over $20 billion USD in trading volume in November 2018, whereas Bitstamp saw $2 billion USD in trading volume in that same time — an order-of-magnitude difference. Therefore, treating any single liquidity provider’s data as representative of the overall market is myopic.
- Liquidity providers routinely experience interruptions in data collection. For instance, virtually every exchange undergoes regularly scheduled maintenance at one point or another, at which point their order books are unavailable and they therefore have no market data to collect or report. At best, this can prevent analysts from getting a full picture of market performance; at worst, it can make it virtually impossible to build metrics such as historical volatility indices.
Building volatility indices that collect real-time data from many distinct liquidity providers mitigates both of these problems: collecting and averaging data from different sources prevents any single source from having an outsized impact on our view of the market, and it also allows us to still have data for analysis even if one or two of those sources experience interruptions. We use five redundant data collection mechanisms for each exchange in order to ensure that our data collection will remain uninterrupted even in the event of multiple failures.
The above references an opinion and is for informational purposes only. It is not intended as and does not constitute investment advice, and is not an offer to buy or sell or a solicitation of an offer to buy or sell any cryptocurrency, security, product, service or investment. Seek a duly licensed professional for investment advice. The information provided here or in any communication containing a link to this site is not intended for distribution to, or use by, any person or entity in any jurisdiction or country where such distribution or use would be contrary to law or regulation or which would subject SFOX, Inc. or its affiliates to any registration requirement within such jurisdiction or country. Neither the information, nor any opinion contained in this site constitutes a solicitation or offer by SFOX, Inc. or its affiliates to buy or sell any cryptocurrencies, securities, futures, options or other financial instruments or provide any investment advice or service.