
Summary:
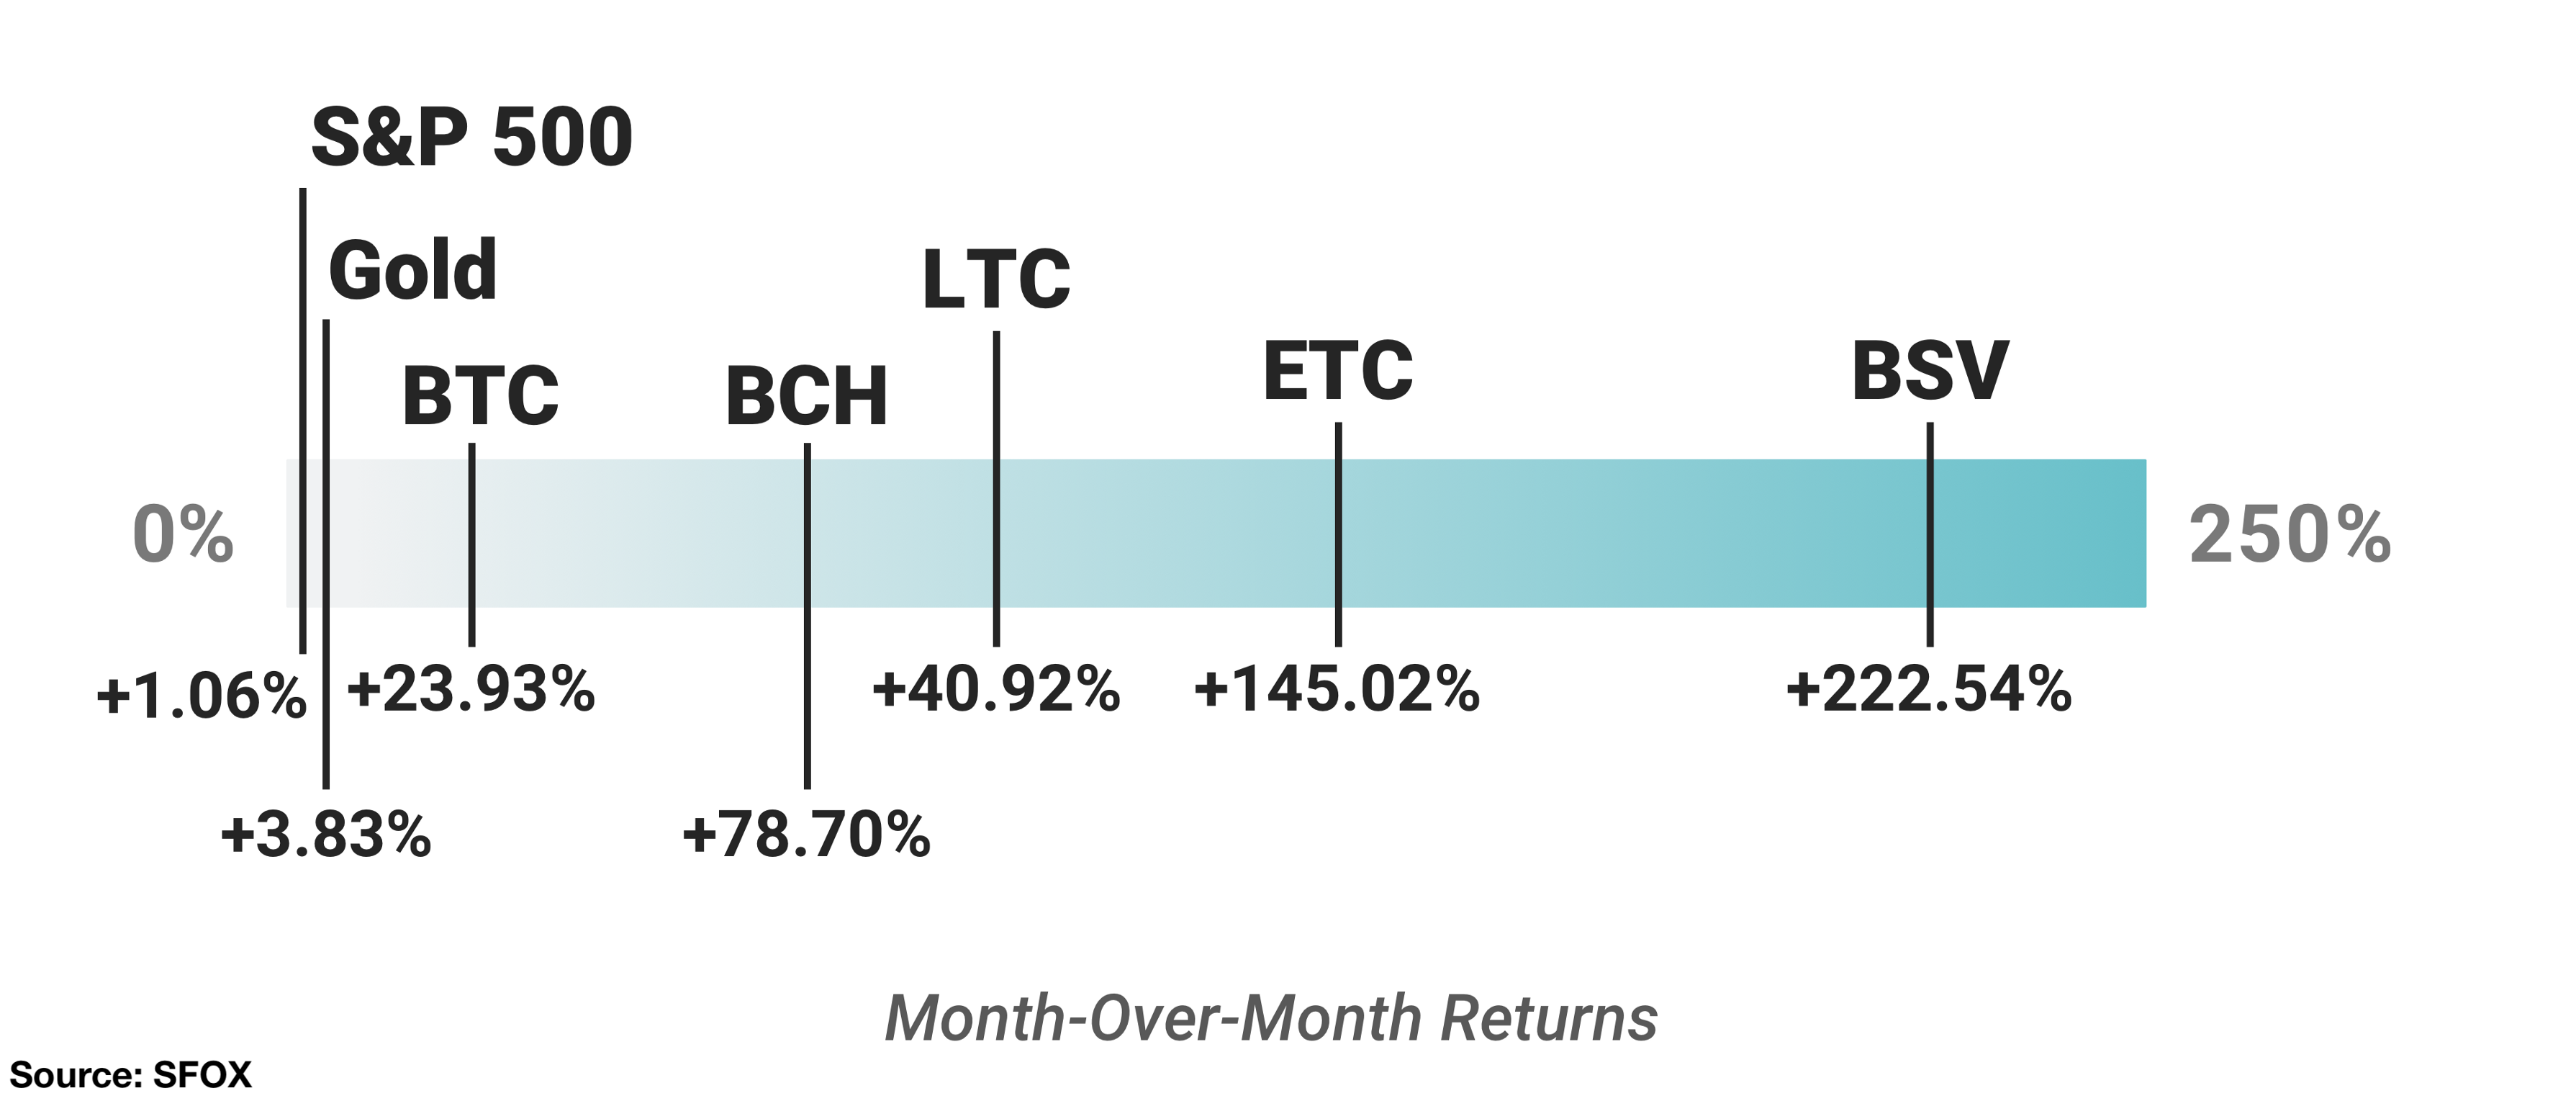
- All major crypto assets ended January with larger month-over-month returns than gold and the S&P 500, with returns as high as 222.54% (BSV).
- The SFOX Multi-Factor Market Index remains at neutral as of the start of February, though it is trending slightly away from the bullish direction and towards the bearish direction.
- Watch for more regulatory clarity / national adoption of crypto, geopolitical conflicts, and further news or analyses of the Bitcoin block reward halving to potentially impact the crypto market in the coming months.
In the February 2020 edition of the SFOX crypto market report, the SFOX Research Team reviews the crypto market’s volatility, correlations, and other performance metrics throughout the past month. We’ve aggregated price, volume, correlations, and volatility data from eight major exchanges and liquidity providers to analyze the global performance of the 6 leading cryptoassets — BTC, ETH, BCH, LTC, BSV, and ETC — all of which are available for algorithmic trading on our trading platform.
The following is a report and analysis of their volatility, price correlations, and further development in the month of January. (For more information on data sources and methodology, please consult the appendix at the end of the report.)
SFOX’s Current Crypto Market Outlook: Neutral
Based on our calculations and analyses, the SFOX Multi-Factor Market Index, which was set at neutral a month ago, remains at neutral as of February 4th — though, within the confines of that rating, it has moved away from the bullish direction of the index (+1) towards the bearish direction of the index (-1).
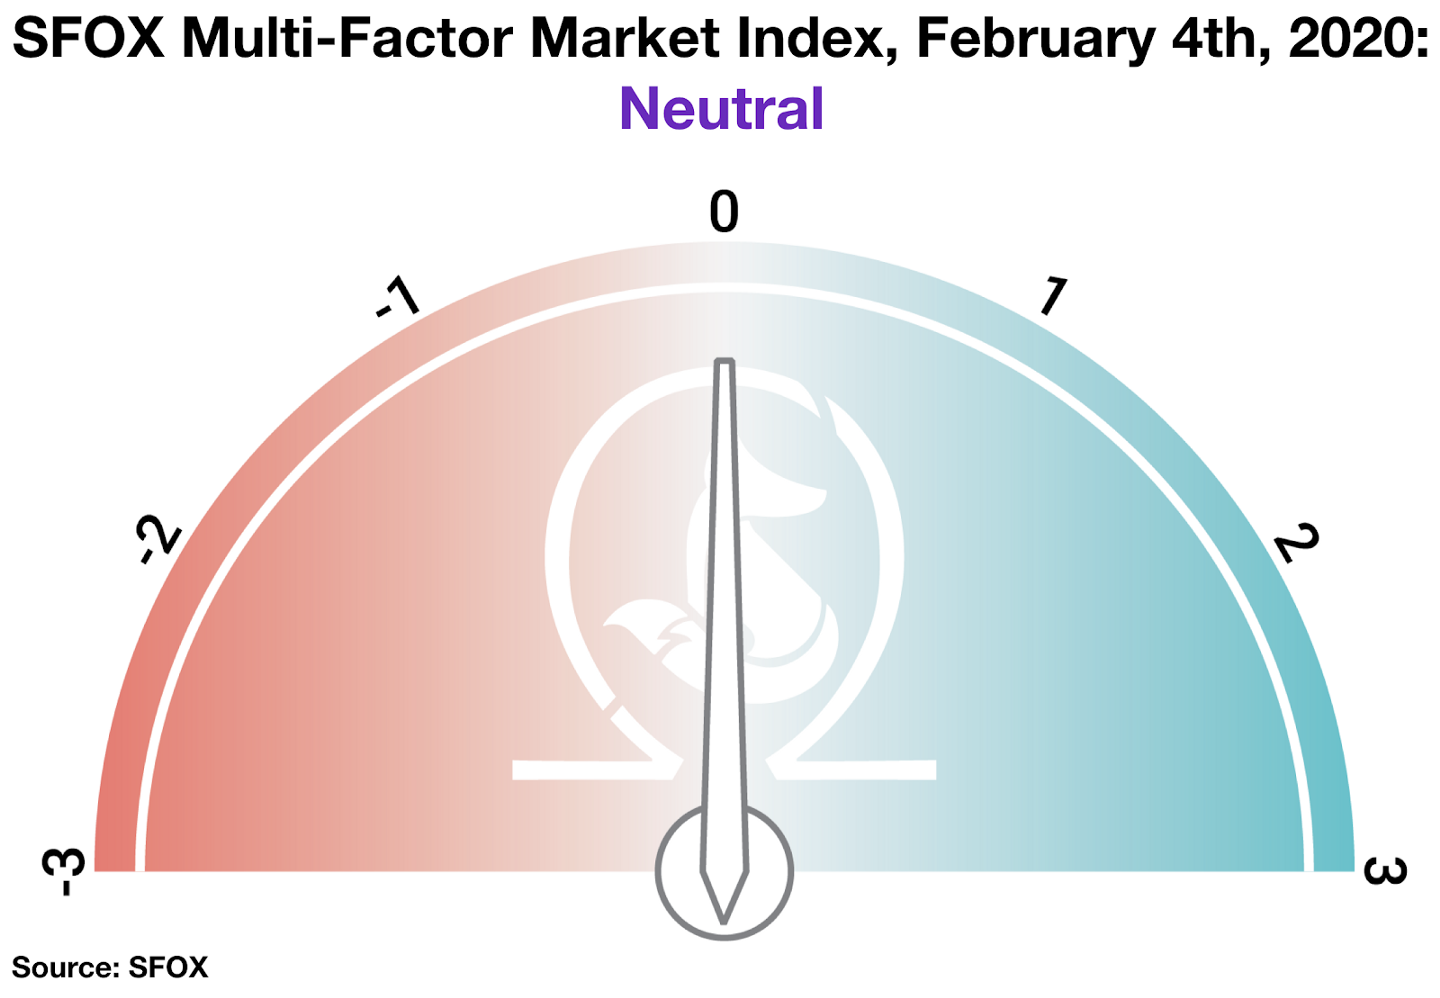
We determine the monthly value of this index by using proprietary, quantifiable indicators to analyze four market factors: price momentum, market sentiment, volatility, and continued advancement of the sector. It is calculated using a proprietary formula that combines quantified data on search traffic, blockchain transactions, and moving averages. The index ranges from highly bearish to highly bullish.
All major crypto assets tracked by this report finished January with month-over-month gains — some gains greater than 100%:
While prices appear to be increasing and substantial growth is happening in terms of institutional product offerings and regulatory clarity, there are still significant unknowns hovering over the market at large. To name a few which we’ll consider below: it’s not clear whether Bitcoin will function as a safe haven in coming geopolitical turmoil; it’s not clear how much institutional appetite is actually there for all the institutional crypto offerings being launched; and it’s not clear what impact the upcoming Bitcoin block reward halving, just four months away, will have on the price of BTC.
Get the SFOX edge in volatile times through our proprietary algorithms directly from your SFOX account.
What’s Happened in January and What to Watch in February
Markets
U.S.-Iran tensions reignited the question of bitcoin as a safe-haven asset (January 3rd — 9th). Bitcoin appeared to be responsive to the geopolitical tension that flared between the U.S. and Iran at the beginning of the year. In the hours after a U.S. strike killed Iranian General Qassem Soleimani on the night of January 2nd, the price of BTC rose 5%, compared with a 3% increase in oil’s price and a 2% increase in gold’s price. After the subsequent Iranian missile strike on January 8th, the price of BTC increased 5% again; after President Trump commented the next day that Iran appeared to be “standing down,” the price of BTC fell 4%.
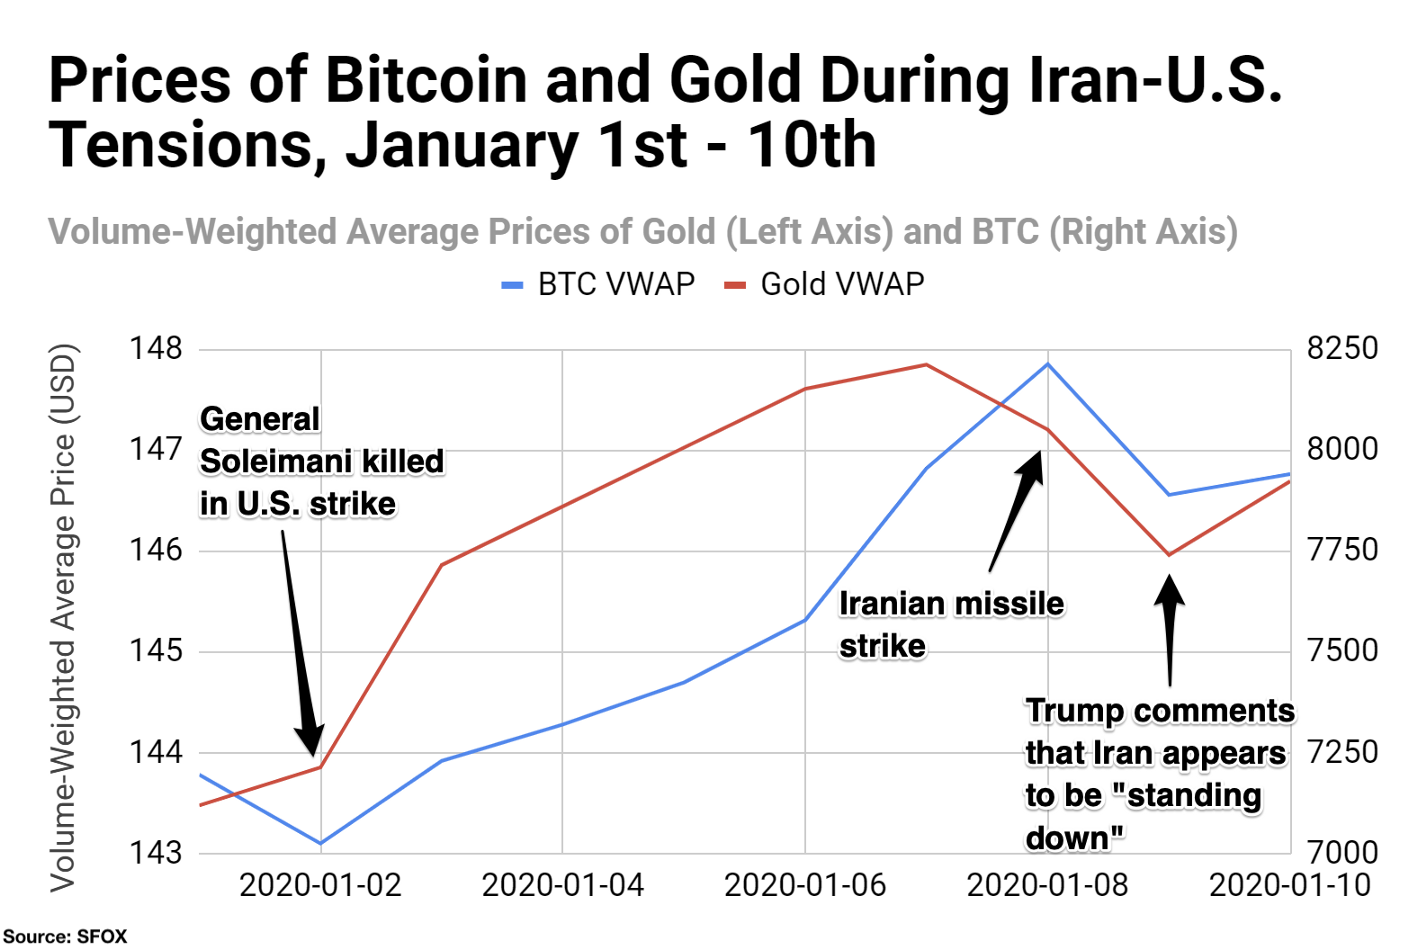
While these events alone don’t constitute a trend, they prompted some to revisit the question of whether BTC may be poised to become a safe-haven asset, like gold, in times of geopolitical turmoil. Traders may want to consider keeping an eye on the movements of BTC during any similarly geopolitically tumultuous times in the future to see if there are similar price increases, which would theoretically provide further evidence of BTC becoming a safe-haven asset.
Products
Burger King Venezuela started accepting crypto (January 4th). In partnership with Cryptobuyer, a Caracas-based Burger King branch started accepting bitcoin, ethereum, litecoin, and other cryptocurrencies at the end of last year; according to Dash leadership, the partnership aims to expand to all 40 Venezuelan Burger King branches throughout 2020. As CoinTelegraph noted, Burger King has tried similar crypto-based payment experiments in Russia and Europe previously with minimal success; however, the economic turmoil from which Venezuela continues to suffer could provide a unique look into whether mainstream businesses can better serve the economically handicapped through crypto.
OKEx and the CME’s Bitcoin options products went live (January 9th; January 13th). The crypto derivatives market continued its rollout of new products with BTC options going live on OKEx and the CME. While many expect institutional stakes in BTC and crypto to increase in this second decade of the sector, it remains to be seen whether that institutional appetite for crypto derivatives is already here: some, such as JP Morgan managing director Nikolaos Panigirtzoglou, claim that institutional interest in BTC options was markedly high around the CME’s options launch; yet others, like Marie Huillet for CoinTelegraph, point to lackluster volume in the first month of Bakkt’s options offering as a sign that institutional demand may not be there yet.
Regulatory
The South Korean Presidential Committee recommends BTC derivatives products as a way of institutionalizing cryptocurrencies (January 6th). South Korea appears to be acknowledging the importance of building infrastructure to support and lead in digital assets going into the new decade. The South Korean Presidential Committee on the Fourth Industrial Revolution recommended this month that the government should allow financial institutions to offer crypto derivative products; they also recommended that the Korean financial sector should invest in a local digital asset custody solution in order to avoid relying on international custody solutions. This apparent support of decentralized cryptocurrencies like Bitcoin provides a salient counterpoint to China’s development of a state-controlled, centralized digital asset; traders may want to keep an eye on which of these approaches proves more successful in the coming months and years.
Greyscale announced itself to be the first Bitcoin trust to start regularly reporting to the SEC (January 21st). The Greyscale Investment Trust, which manages $2B in Bitcoin exposure, announced last month that it has become “the first digital currency investment vehicle to attain the status of an SEC reporting company.” This marks not only continued development in regulatory acceptance of crypto investment vehicles, but also another step towards some kind of publicly-traded BTC fund.
Zermatt became the second Swiss location to accept taxes in BTC, in partnership with Bitcoin Suisse (January 28th). Following Zug’s example, Zermatt became the second Swiss location to allow taxpayers to pay their taxes in bitcoin. This marks another example of a governmental body effectively legitimizing Bitcoin as a form of legal tender, a crucial step as Bitcoin and crypto evolve into a fully-fledged, global asset class. As relatively small as a couple of Swiss towns may be, market participants may want to watch for similar, seemingly small examples of towns and cities recognizing Bitcoin throughout the rest of 2020 — they could potentially mark the start of a broader trend towards global recognition of Bitcoin as a medium of payment.
Technical Developments
Analysts continue to debate how the upcoming Bitcoin mining reward halving will impact BTC’s price and whether or not it has already been priced in. As SFOX considered in the year-end 2019 crypto market report, debate over the impact of the upcoming havling of the BTC block reward (due to happen this May) on BTC’s price continues to be a prominent point of debate among analysts, and may remain so up through May. Market research firm Fundstrat made news on January 11th claiming that the halving was not yet priced in and that this factor, among others, made it likely in their view that BTC could show >100% returns in 2020; in contrasts, Morgan Creek Digital co-founder Jason Williams claimed just a month earlier that the halving would be a “non-event” with respect to BTC’s price. With BTC still so young and only a few historical halvings of BTC to look to, it seems to be anyone’s guess whether and how BTC’s price could move around the time of the upcoming halving — and, indeed, there seem to be as many different guesses as there are market analysts.
The Details: January 2020 Crypto Price, Volatility, and Correlation Data
Price Performance: Gradual Increase
Bitcoin opened 2020 at the price of $7,195.49; over the course of the month, it gradually climbed to a price of $9,048.59 — an increase of almost 26% in one month.
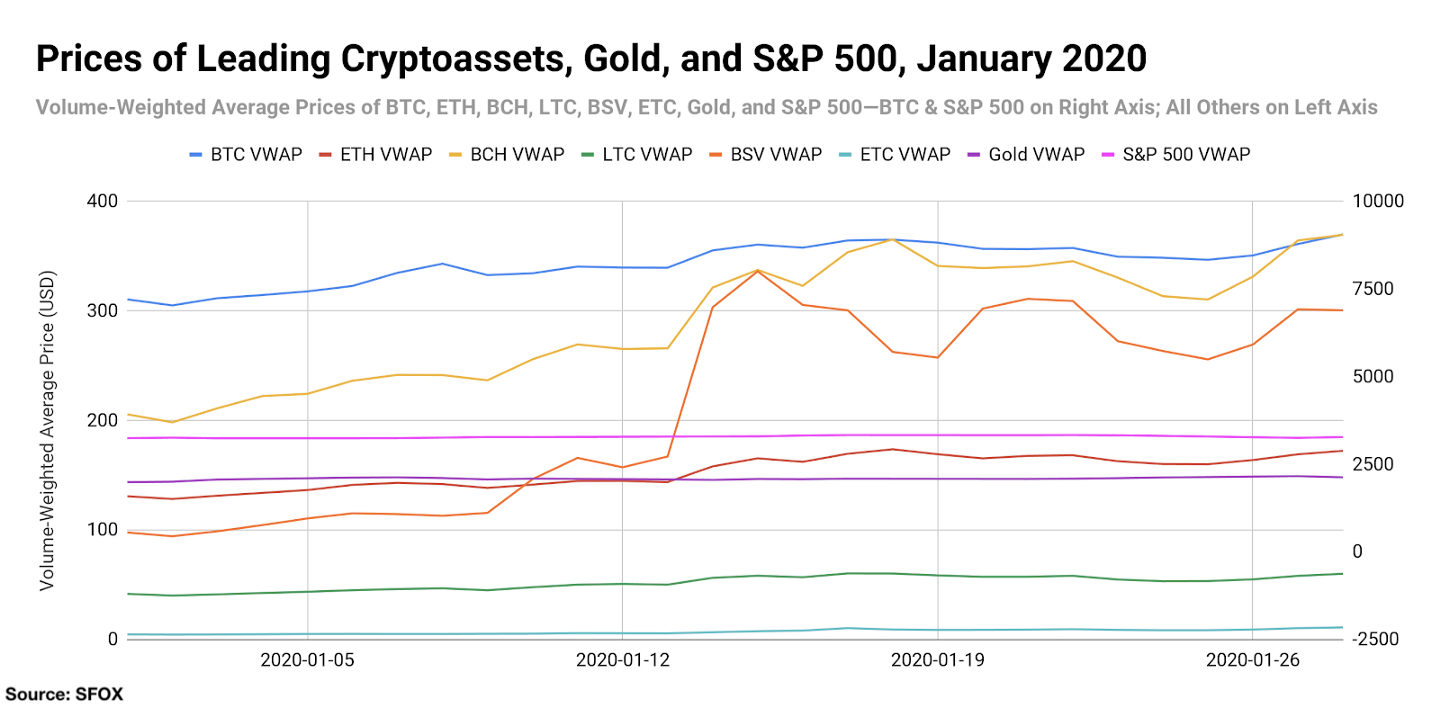
Bitcoin SV showed the greatest fluctuations in terms of daily returns, showing 81.64% return in a single day (January 13th) and losses as great as 12.64% in a single day (January 17th).
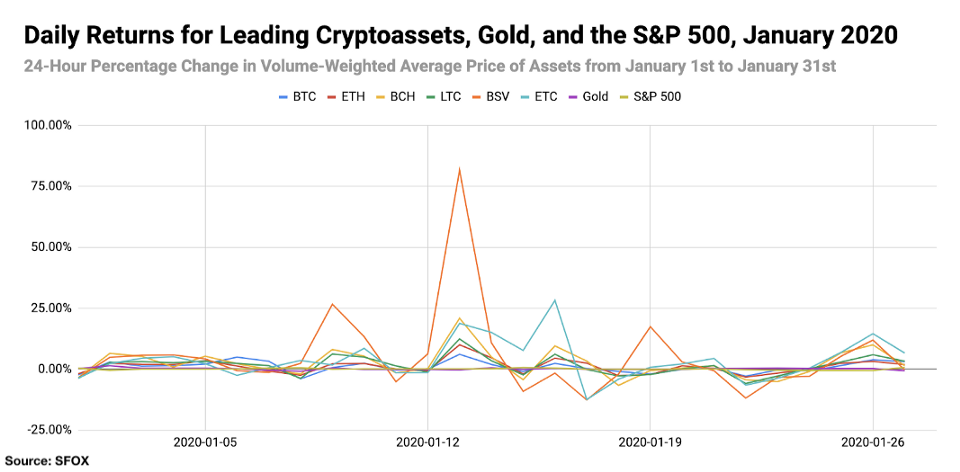
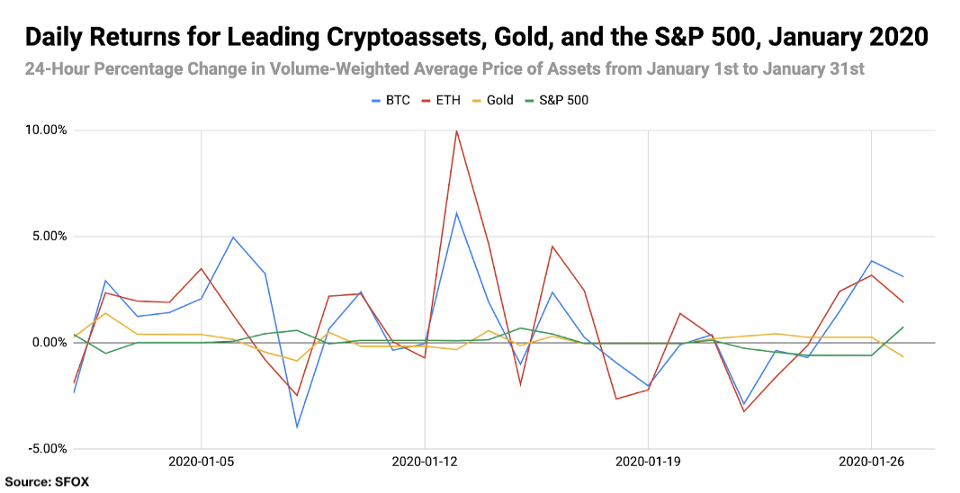
For greater graphical clarity, see this additional chart tracking only the daily returns of BTC, ETH, gold, and the S&P 500:
All leading cryptoassets showed month-over-month gains. Bitcoin SV showed the largest gains at an increase of 222.54%, while Bitcoin showed the smallest gains at 23.93%; all leading cryptoassets showed greater MoM gains than those of gold and the S&P 500 (3.83% and 1.06%, respectively).
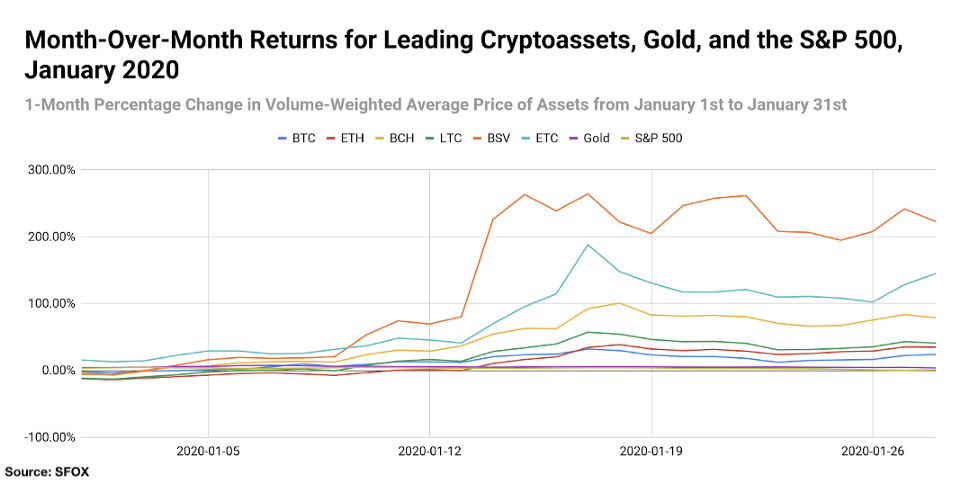
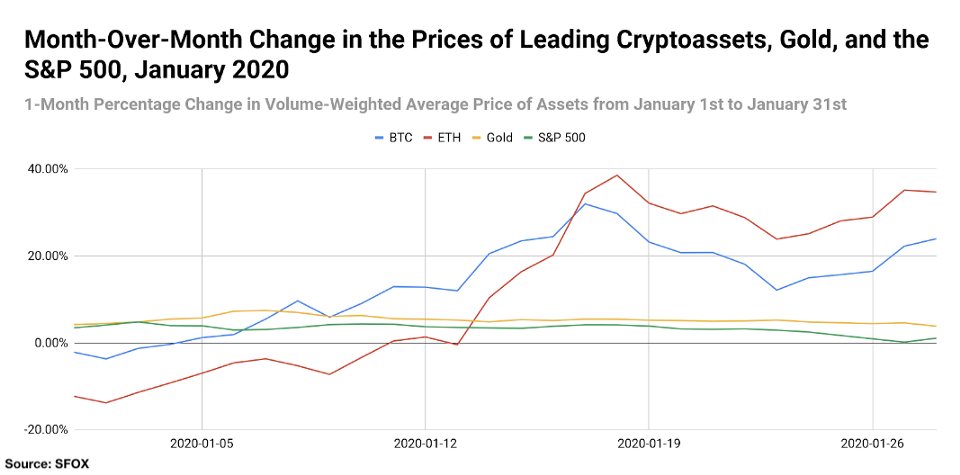
For greater graphical clarity, see this additional chart tracking only the month-over-month changes in the prices of BTC, ETH, gold, and the S&P 500:
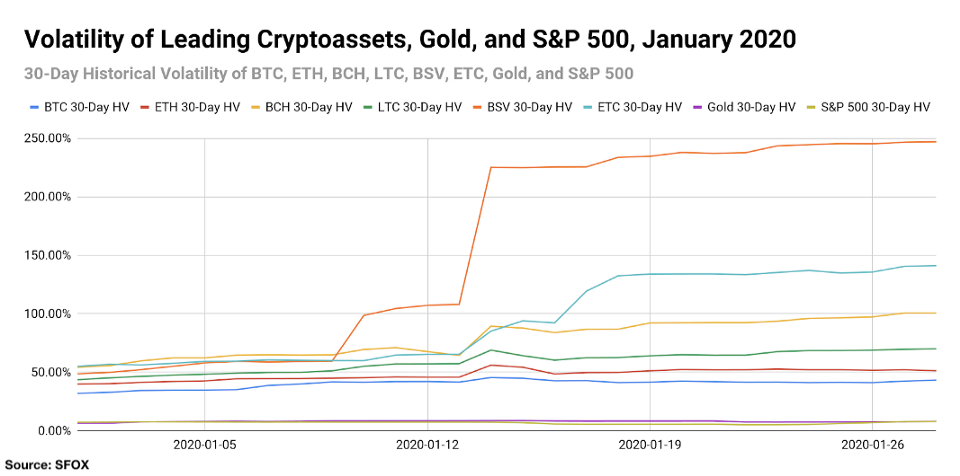
Volatility: The Comeback Kid
By looking at the 30-day historical volatilities of BTC, ETH, BCH, LTC, BSV, and ETC, we see that crypto volatility made a comeback in January of 2020: all major cryptoassets were more volatile at the end of the month than they were at the beginning of the month. BTC started the month with 30-day HV of 31.94% and ended the month with 30-day HV of 43.27%; meanwhile, BSV was again a standout, climbed from 30-day HV of 48.68% at the start of the month to 30-day HV of 247.03% at the end of the month.
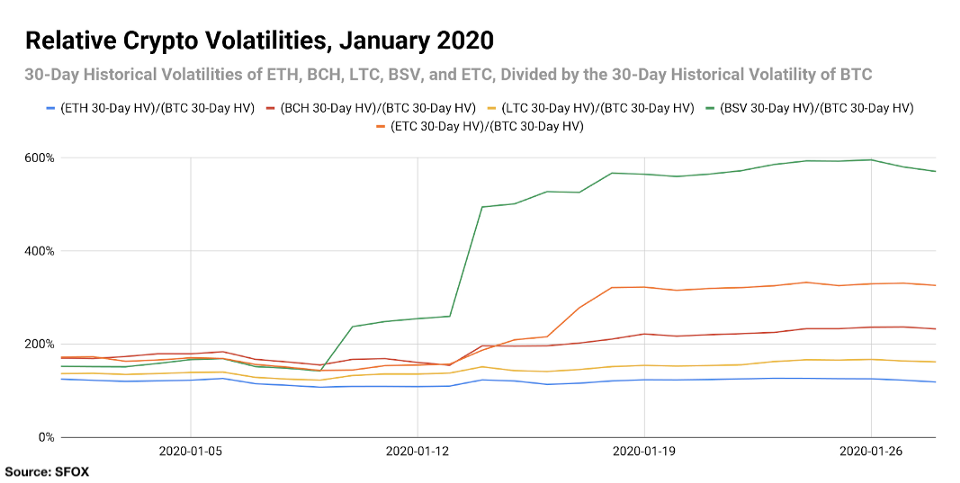
By looking at the 30-day historical volatilities of ETH, BCH, LTC, BSV, and ETC as a percentage of BTC’s 30-day historical volatility, we can see that BSV and ETC specifically experienced substantial increases in volatility independent of BTC’s volatility — consistent with the patterns in their volatility that we previously observed throughout 2019.
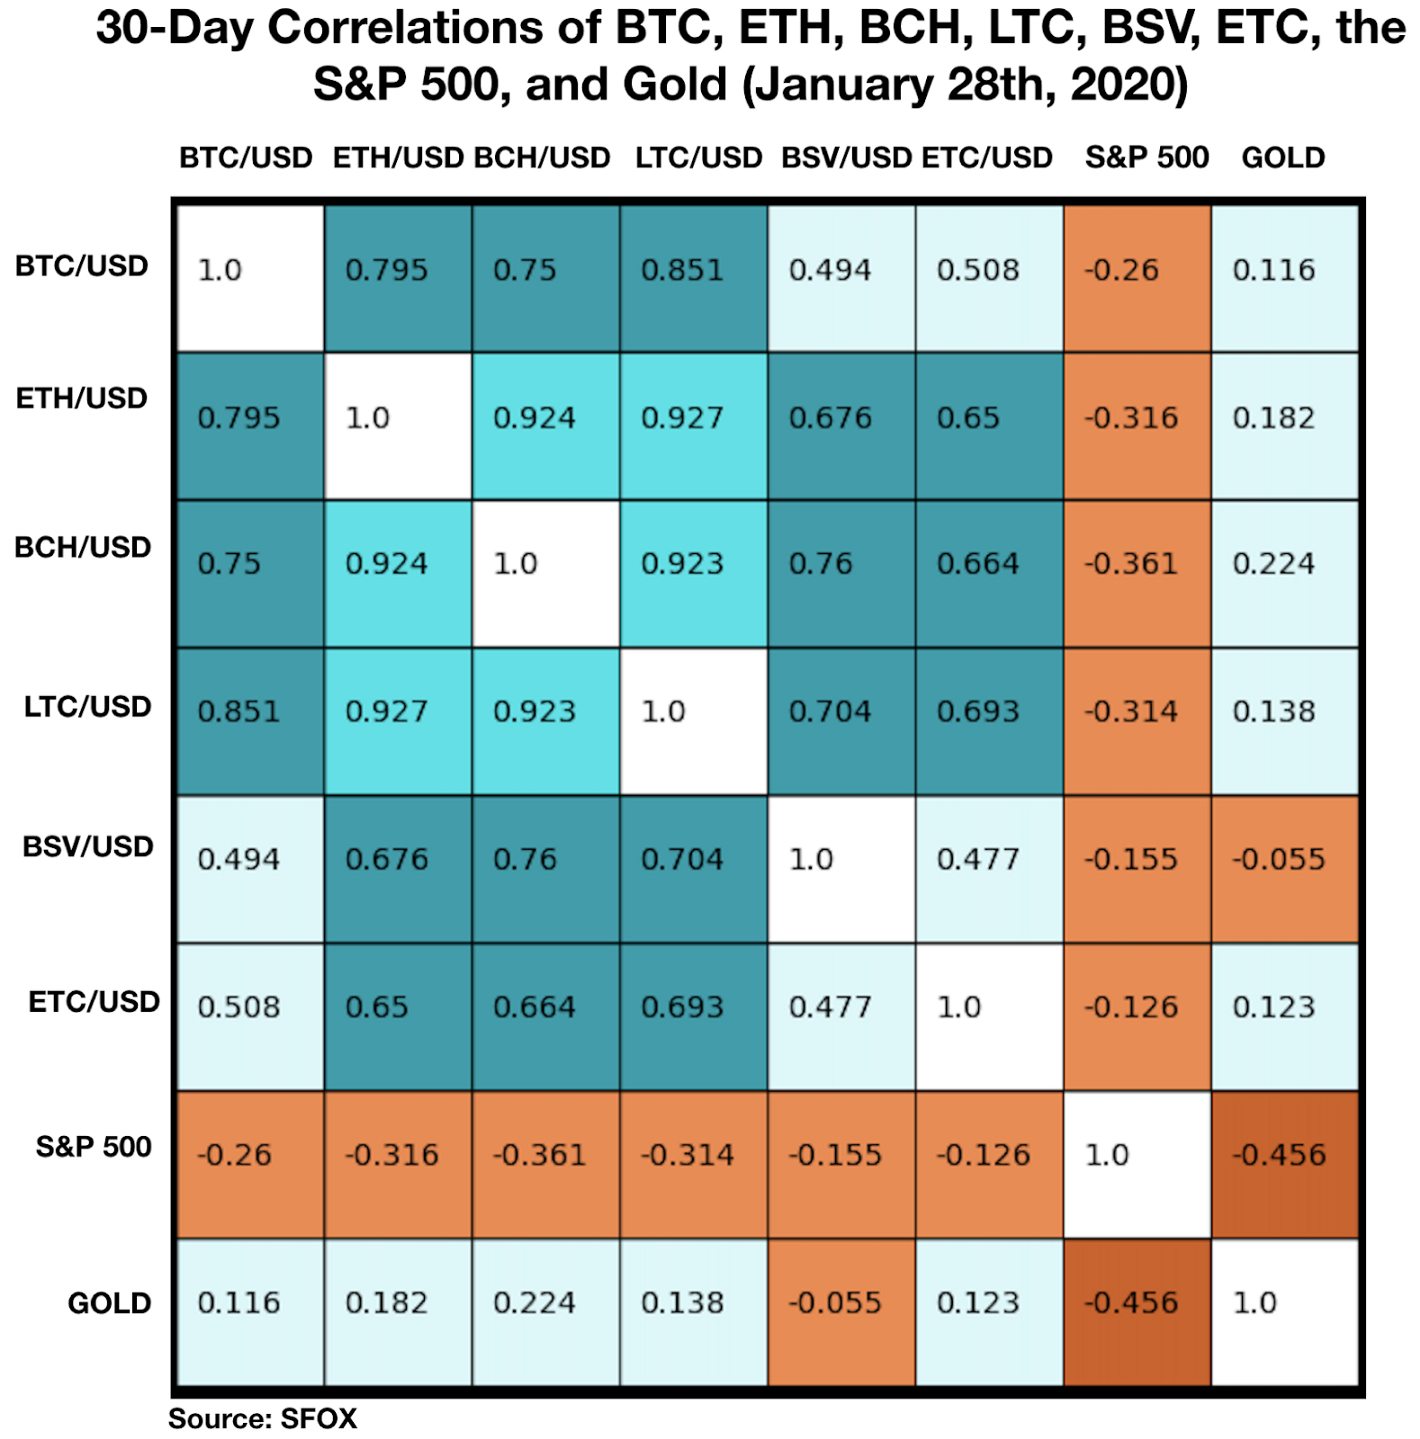
Price Correlations: BSV and ETC Break Away From BTC
The most recent crypto correlations data show that BTC has maintained a relatively low correlation (~0.5) with BSV and ETC, in contrast to higher correlations with ETH, BCH, and LTC. This observation is consistent with the high volatility that BSV and ETC observed independent of BTC throughout January. All cryptoassets remain largely uncorrelated with gold and the S&P 500.
See the full SFOX crypto correlations matrix below:
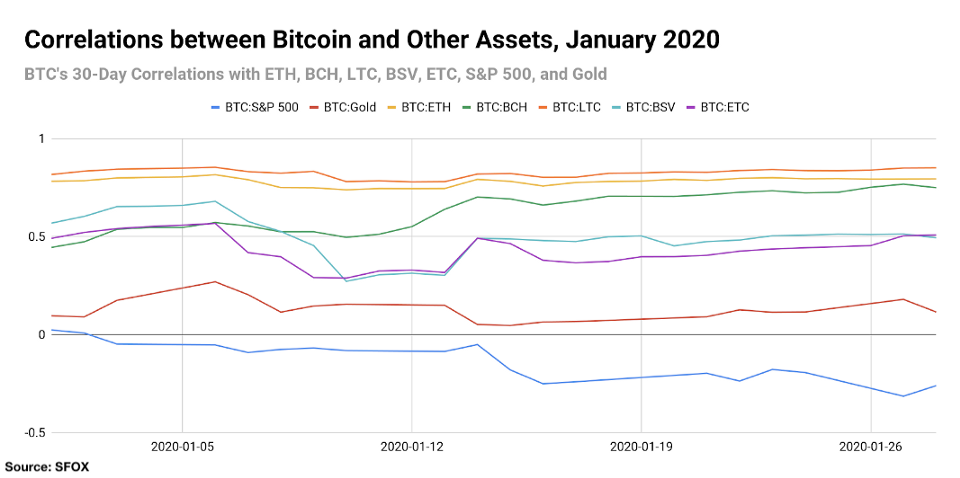
For a more complete look at BTC’s correlations with other assets throughout the past year, see the following graph:
Appendix: Data Sources, Definitions, and Methodology
Note that, as of the start of 2020, the naming conventions of SFOX’s monthly report have changed: the report is now called a “crypto market report” rather than a “volatility report” so as to better reflective the full scope of the data and analysis involved. Each monthly report is also now named after the month in which it is released, rather than the month which it is analyzing (i.e. this report, which analyzes the month of January, is the February report).
All cryptocurrency prices are denominated in USD unless otherwise noted.
Note that data collection for ETC began on January 16th, 2019, and data collection for BSV began on March 11th, 2019; therefore, this report does not reflect a full year of data for these two cryptoassets.
We use two different in-house volatility indices in creating these reports:
1. 30-day historical volatility (HV) indices are calculated from daily snapshots over the relevant 30-day period using the formula:
30-Day HV Index = σ(Ln(P1/P0), Ln(P2/P1), …, Ln(P30/P29)) * √(365)
2. Daily historical volatility (HV) indices are calculated from 1440 snapshots over the relevant 24-hour period using the formula:
Daily HV Index = σ(Ln(P1/P0), Ln(P2/P1), …, Ln(P1440/P1439))* √(1440)
S&P 500 performance data are collected from Yahoo! Finance using GSPC (S&P 500 Index) data. Gold performance data are collected from Yahoo! Finance using XAU (Philadelphia Gold and Silver Index) data.
30-day asset correlations are calculated using the Pearson method, in accordance with the following formula:
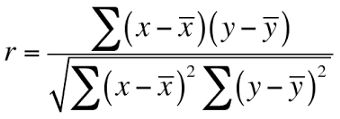
In our calculations, x = 30-day returns for BTC/USD, y = 30-day returns for the other asset in consideration, and r = the correlation coefficient between BTC and the other asset in consideration.
The cryptoasset data sources aggregated for crypto prices, correlations, and volatility indices presented and analyzed in this report are the following eight exchanges, the order-book data of which we collect and store in real time:
- bitFlyer
- Binance
- Bitstamp
- Bittrex
- Coinbase
- Gemini
- itBit
- Kraken
Our indices’ integration of data from multiple top liquidity providers offers a more holistic view of the crypto market’s minute-to-minute movement. There are two problems with looking to any single liquidity provider for marketwide data:
- Different liquidity providers experience widely varying trade volumes. For example: according to CoinMarketCap, Binance saw over $20 billion USD in trading volume in November 2018, whereas Bitstamp saw $2 billion USD in trading volume in that same time — an order-of-magnitude difference. Therefore, treating any single liquidity provider’s data as representative of the overall market is myopic.
- Liquidity providers routinely experience interruptions in data collection. For instance, virtually every exchange undergoes regularly scheduled maintenance at one point or another, at which point their order books are unavailable and they therefore have no market data to collect or report. At best, this can prevent analysts from getting a full picture of market performance; at worst, it can make it virtually impossible to build metrics such as historical volatility indices.
Building volatility indices that collect real-time data from many distinct liquidity providers mitigates both of these problems: collecting and averaging data from different sources prevents any single source from having an outsized impact on our view of the market, and it also allows us to still have data for analysis even if one or two of those sources experience interruptions. We use five redundant data collection mechanisms for each exchange in order to ensure that our data collection will remain uninterrupted even in the event of multiple failures.
The above references an opinion and is for informational purposes only. It is not intended as and does not constitute investment advice, and is not an offer to buy or sell or a solicitation of an offer to buy or sell any cryptocurrency, security, product, service or investment. Seek a duly licensed professional for investment advice. The information provided here or in any communication containing a link to this site is not intended for distribution to, or use by, any person or entity in any jurisdiction or country where such distribution or use would be contrary to law or regulation or which would subject SFOX, Inc. or its affiliates to any registration requirement within such jurisdiction or country. Neither the information, nor any opinion contained in this site constitutes a solicitation or offer by SFOX, Inc. or its affiliates to buy or sell any cryptocurrencies, securities, futures, options or other financial instruments or provide any investment advice or service.