Summary:
- Bitcoin closed out 2019 higher year-over-year returns than the S&P 500 and gold (93.80%), low historical volatility (32.05%), and lack of correlation with the S&P 500 and gold.
- The SFOX Multi-Factor Market Index remains at neutral as we enter 2020, though it is trending slightly away from the bearish direction and towards the bullish direction.
- Leading cryptoassets ended the year markedly less correlated with each other than usual.
- Watch for further news about the BTC mining reward halving, new crypto investment products, institutional adoption, and big tech company movements for or against crypto to potentially impact the sector’s volatility in the new year.
To usher in the new year, the SFOX Research Team is pleased to offer this review of the crypto market’s volatility, correlations, and other performance metrics through the end of December 2019. We’ve aggregated price, volume, correlations, and volatility data from eight major exchanges and liquidity providers to analyze the global performance of the 6 leading cryptoassets — BTC, ETH, BCH, LTC, BSV, and ETC — all of which are available for algorithmic trading on our trading platform.
The following is a report and analysis of their volatility, price correlations, and further development in the past year, with an emphasis on the last month of December. (For more information on data sources and methodology, please consult the appendix at the end of the report.)
SFOX’s Current Crypto Market Outlook: Neutral
Based on our calculations and analyses, the SFOX Multi-Factor Market Index, which was set at neutral a month ago, remains at neutral as of January 2nd — though, within the confines of that rating it has begun to move slightly away from the bearish direction of the index (-1) towards the bullish direction of the index (+1).
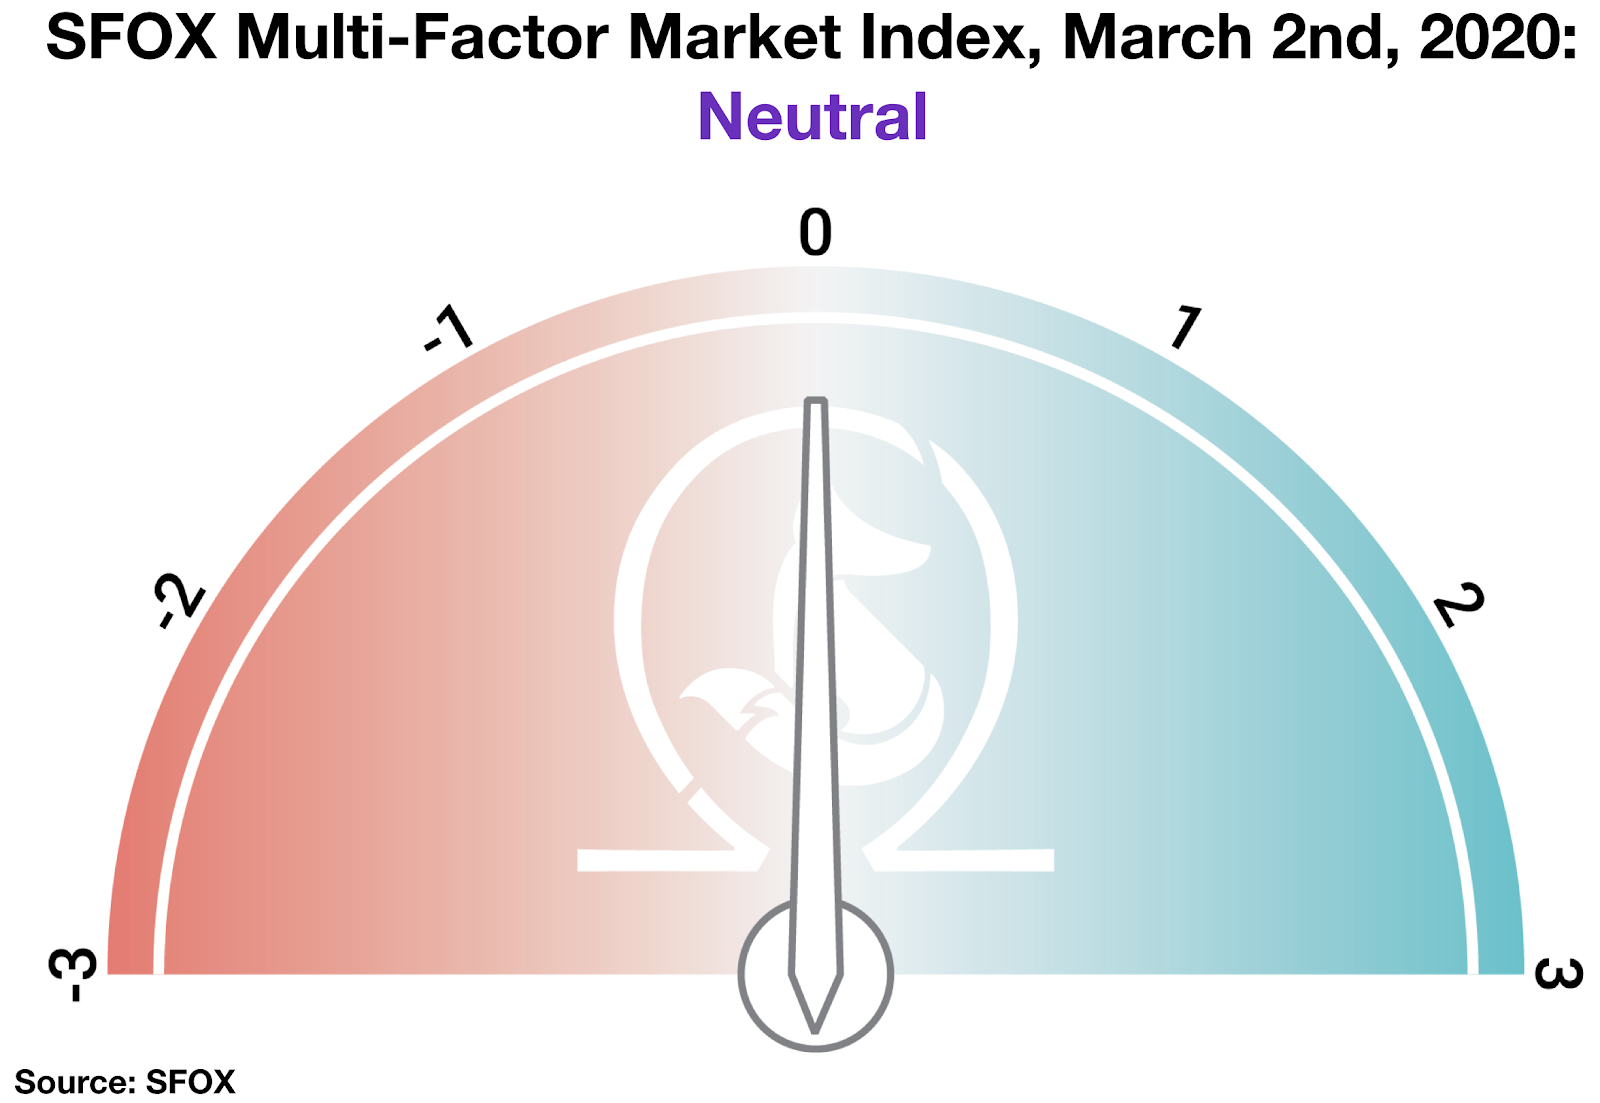
We determine the monthly value of this index by using proprietary, quantifiable indicators to analyze four market factors: price momentum, market sentiment, volatility, and continued advancement of the sector. It is calculated using a proprietary formula that combines quantified data on search traffic, blockchain transactions, and moving averages. The index ranges from highly bearish to highly bullish.
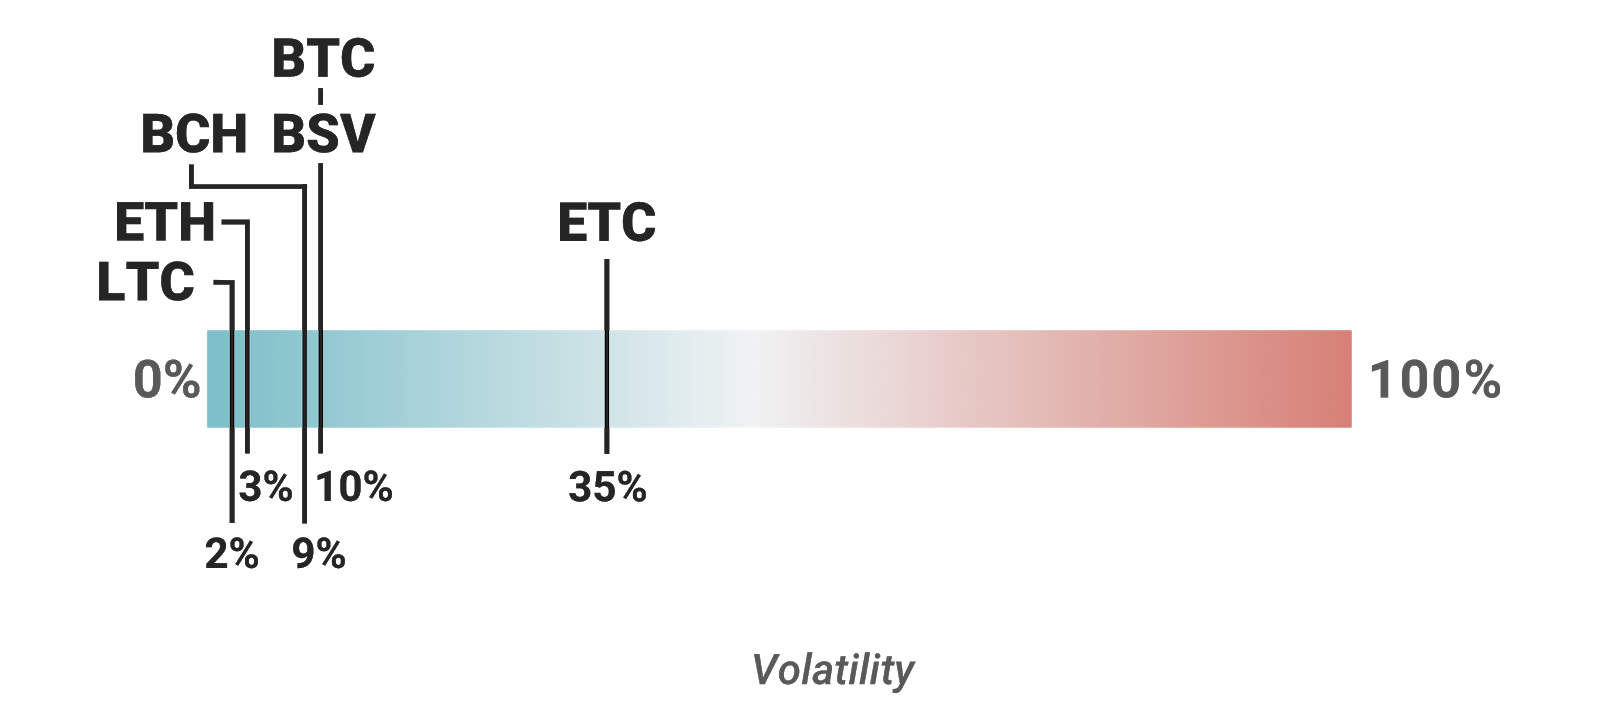
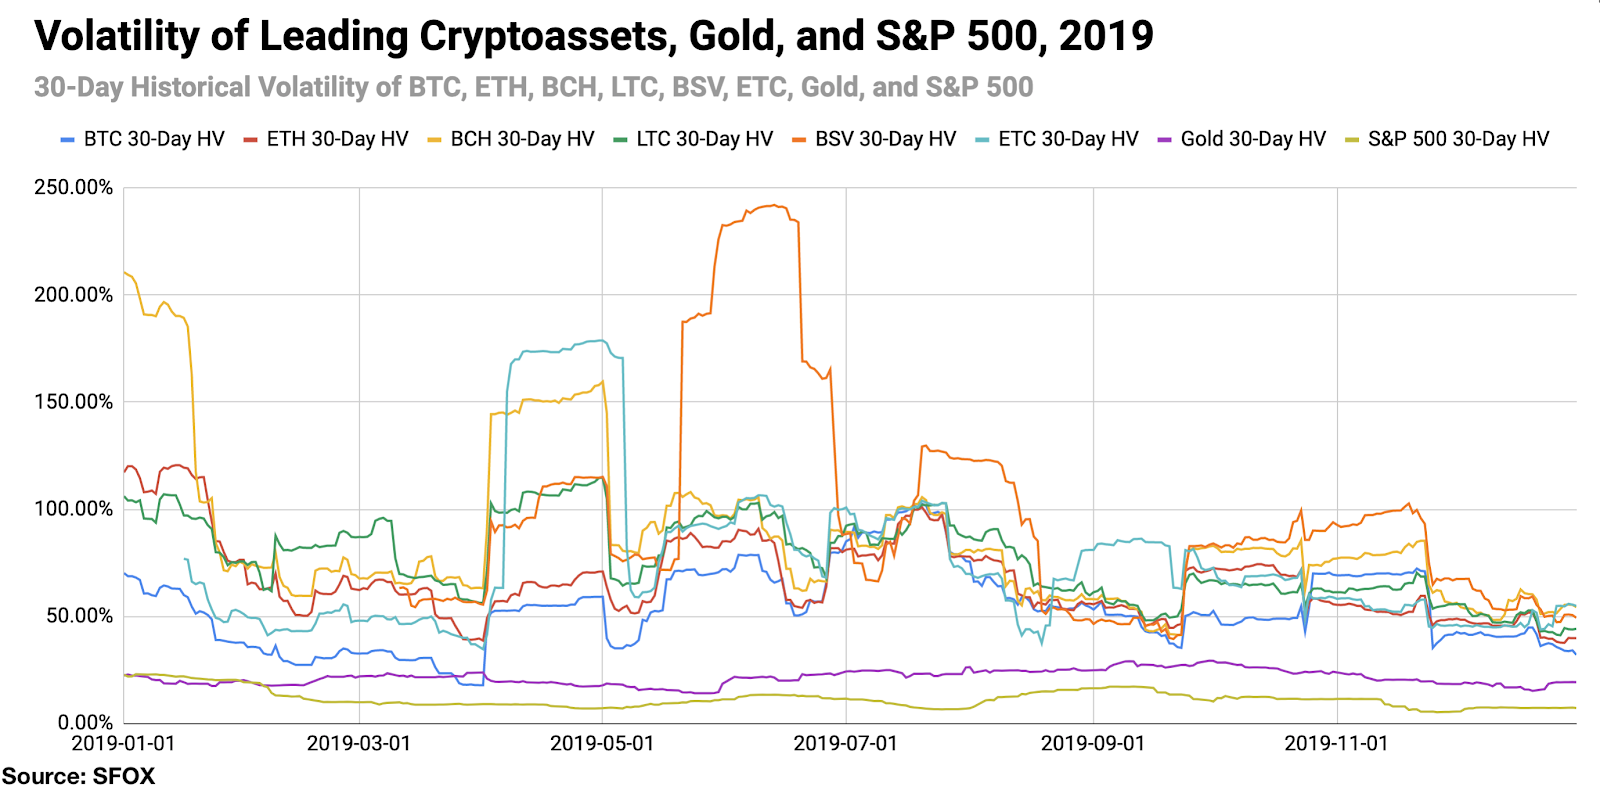
Relative to the ICO craze and headline-making hard forks of a couple of years ago, 2019 ended relatively quietly for crypto. The historical volatilities of all leading cryptoassets — i.e. their standard deviations from their 30-day average price — ended the year in very low percentiles relative to their volatility ranges over the last year (with the exception of ETC):
Meanwhile, BTC closed 2019 with higher year-over-year returns than the S&P 500, gold, ETH, BCH, or LTC:
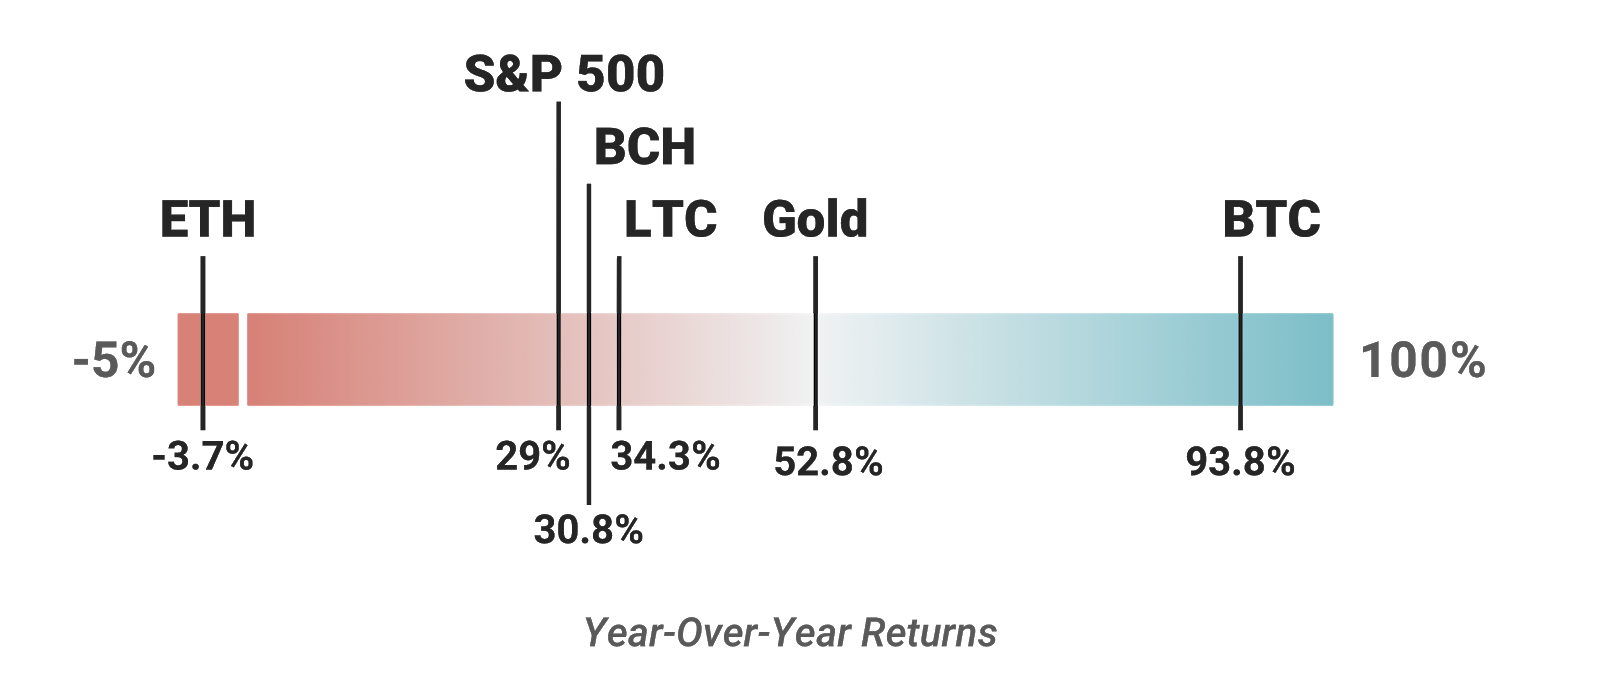
Combined with the fact that BTC is proving to be largely uncorrelated with both the S&P 500 and gold (average 30-day correlation values of -0.037 and 0.149, respectively, in the last 6 months), these data about Bitcoin’s high returns and low volatility made BTC a compelling tool for portfolio management in 2019. However, it’s worth bearing in mind that this alone is a small data set and there is already significant implied volatility of roughly 70% priced into BTC options for June and September of 2020 at the time of writing, so whether these data will persist as trends into the new year is unclear. It’s also worth noting that the Sharpe ratio (a measure of risk-adjusted returns that calculates the average return on an asset per unit of that asset’s volatility) for BTC in 2019 was 1.74, whereas the Sharpe ratio for the S&P 500 for 2019 was 2.54; this essentially means that, when their rates of returns are adjusted for their respective levels of risk (as measured by their standard deviations), the S&P 500 outperformed BTC in 2019.
Part of the multifactor market’s current neutral rating may be due to the fact that the crypto market appears to be entering a new decade to a number of potentially impactful yet difficult to evaluate factors. BTC options products are beginning to roll out at venues like Bakkt, OKEx, and the CME, but the lukewarm initial reception of Bakkt, which we saw this past September, leaves it unclear whether the institutional appetite for such products is really there yet. Another halving of the Bitcoin mining reward is scheduled for this coming May, leading some to speculate about whether BTC’s price will rise in anticipation of the reduced rate of new supply, as has been the case in the past. And the surprise de-listing of many crypto-focused videos and channels from YouTube in the last week of 2019 is leading some to wonder whether tech giants that are increasingly pursuing entry into financial services may be attempting to mitigate the reach of the crypto sector.
Get the SFOX edge in volatile times through our proprietary algorithms directly from your SFOX account.
What’s Happened in the Last Year and What to Watch in 2020
Markets
Leading cryptoassets closed the year near one-year volatility lows. After becoming more volatile in the middle of the year, BTC and other leading cryptocurrencies finished off the year at relatively low levels of 30-day historical volatility. BTC closed the year at 32.05% 30-day historical volatility, in the tenth percentile of its volatility range throughout the previous year.
hile some traders may be drawn to crypto for its renowned volatility, there has also been discussion in the past as to whether this volatility may detract from some of crypto’s long-term utility — for instance, it’s not clear whether Bitcoin can be useful as a store of value (analogous to gold) if it remains highly volatile. Regardless of how this trend pans out, therefore, traders and long-term investors alike may want to keep an eye on these broader volatility trends in crypto as the next decade of the sector unfolds.
Products
YouTube unexpectedly removed hundreds of crypto videos and channels from their platform, raising the question of Google’s position with regard to the crypto sector (December 26th). Google made crypto news in the last week of 2019 for removing hundreds of crypto-focused videos and channels from YouTube, including many educational primers on crypto and Bitcoin, with no apparent explanation. With much of the crypto news in 2019 being dominated by Facebook’s attempts to develop Libra — a “cryptocurrency” that many have claimed isn’t a cryptocurrency at all — some are wondering whether this may not be an accident on Google’s part, but rather an attempt to deaden the impact of crypto on finance. Writing for Forbes, Billy Bambrough observed that “Google, along with the likes of social media giant Facebook, has been increasingly looking to financial services to bolster advertisement revenue in recent years, with public opinion moving against ad-funded business models.” Crypto market participants may therefore want to keep a close eye on the further actions that big tech companies take against crypto, overtly or otherwise, in the coming year — and in the coming decade, for that matter.
OKEx launches BTC options “for a select group of traders” ahead of a public January launch (December 26th). This follows on the heels of Bakkt’s BTC options launch earlier in the month (December 9th) and comes ahead of the CME’s options offering in mid-January (January 13th). While these products provide professional traders and institutions with more flexibility and optionality in taking on exposure to crypto, the question remains to be seen whether institutional interest will rise to take advantage of these products yet. We saw earlier this year that the CBOE pulled out of BTC futures (March 2019) and that Bakkt’s much-anticipated physically-settled BTC futures launched to lower-than-expected volumes (September 2019). This calls to mind crypto fund manager Tim Enneking’s observation that, given the current market cap of the crypto sector, “there are tens, if not hundreds, of funds on the planet that — ignoring the fact that they’d drive the price up — could buy the entire crypto sector,” suggesting that crypto may simply not yet be a big enough asset class for many institutions to get involved. The open question in 2020, then, is whether institutions will rise to participate in the crypto offerings that continue to be innovated with them in mind.
Regulatory
Germany’s new regulations legitimizing the crypto sector through digital asset custodian licensing are now in effect (January 1st). Germany now has licensing requirements in effect for all companies custodying digital assets; such companies must announce their intentions to apply for a license by April 1st and submit an application by November 1st. As we considered in our last market report, this kind of regulatory clarity is critical to allowing crypto to scale and be adopted on national and international levels. Crypto market participants should keep an eye both on how crypto companies conduct themselves with regard to Germany’s new regulations, and also on which states and countries follow Germany’s example. For now, crypto companies appear to be reacting positively to Germany’s regulations, with Bitstamp’s head of business development, Miha Grčar, calling it evidence that German regulators view crypto as a “legitimate” industry.
Technical Developments
The next Bitcoin mining reward halving is coming in five months, inviting debate about whether and how it will impact BTC’s price in early 2020. Each BTC “halving” cuts the amount of BTC rewarded for successfully mining a new block in the Bitcoin blockchain in half, thereby reducing the rate at which new bitcoins enter circulation. Historically, the price of BTC has increased ahead of halvings, with some attributing the end of BTC’s bear market in 2015 to expectations of the 2016 halving reducing the rate of new bitcoins supplied. So far, this sort of halving anticipation doesn’t appear to be dominating the market, with the price of BTC having fallen over 45% since June 2019, but expectations based on previous halving events could potentially play a role in where markets go in early 2020.
The Details: Comprehensive 2019 Crypto Price, Volatility, and Correlation Data
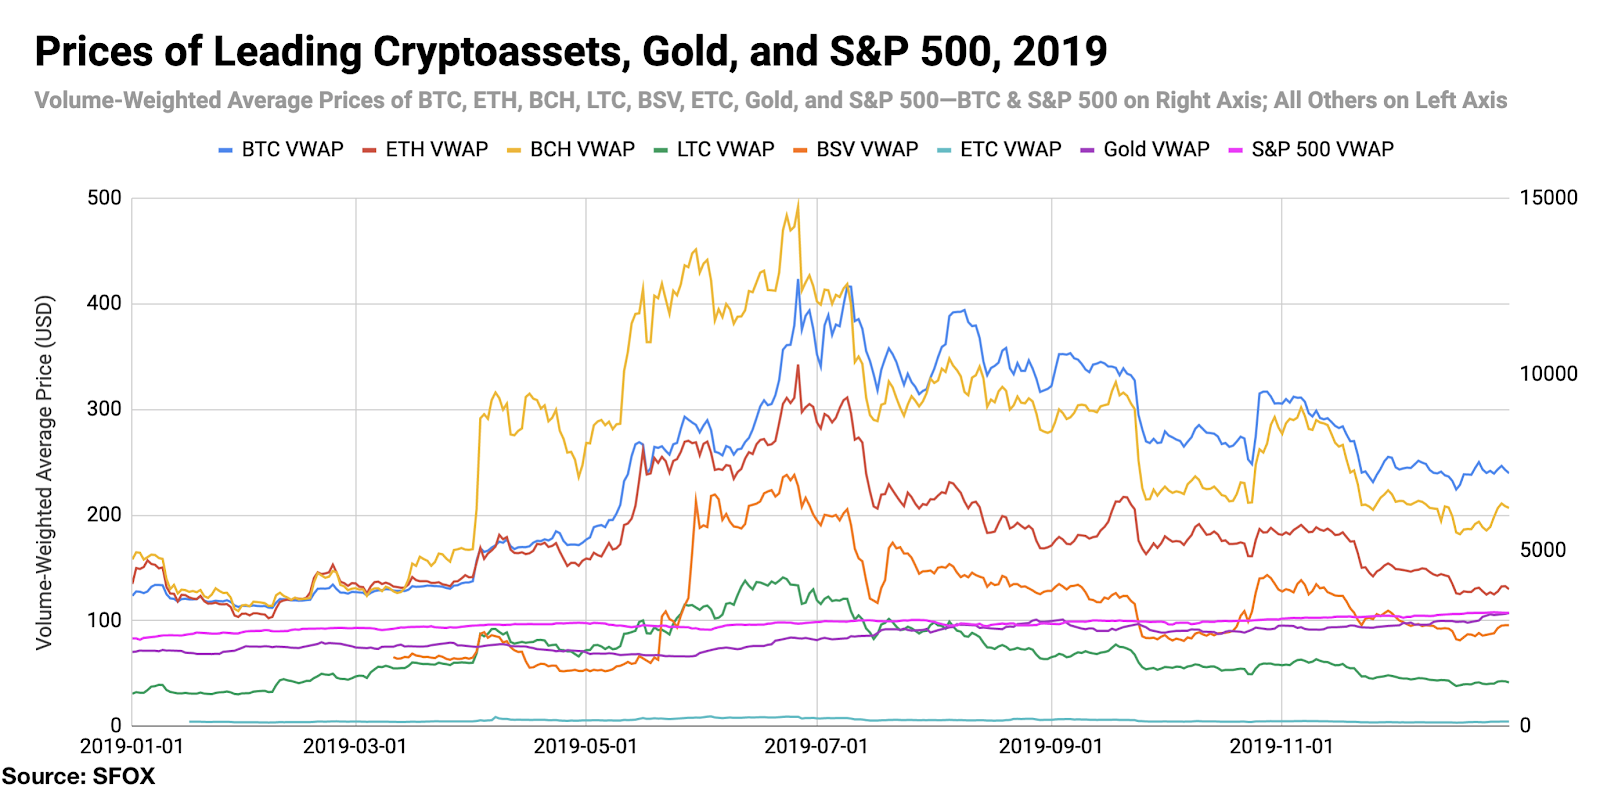
Price Performance: Recovery, Followed by Correction
At the beginning of 2019, traders could buy 1 BTC for $3710.15. Over the following six months, the price of 1 BTC climbed to a peak of $12703.75 on June 26th — an increase of 242% from the beginning of the year. Since then, the price of BTC has decreased and somewhat stabilized around $7000 — currently at $6930 at the time of writing.
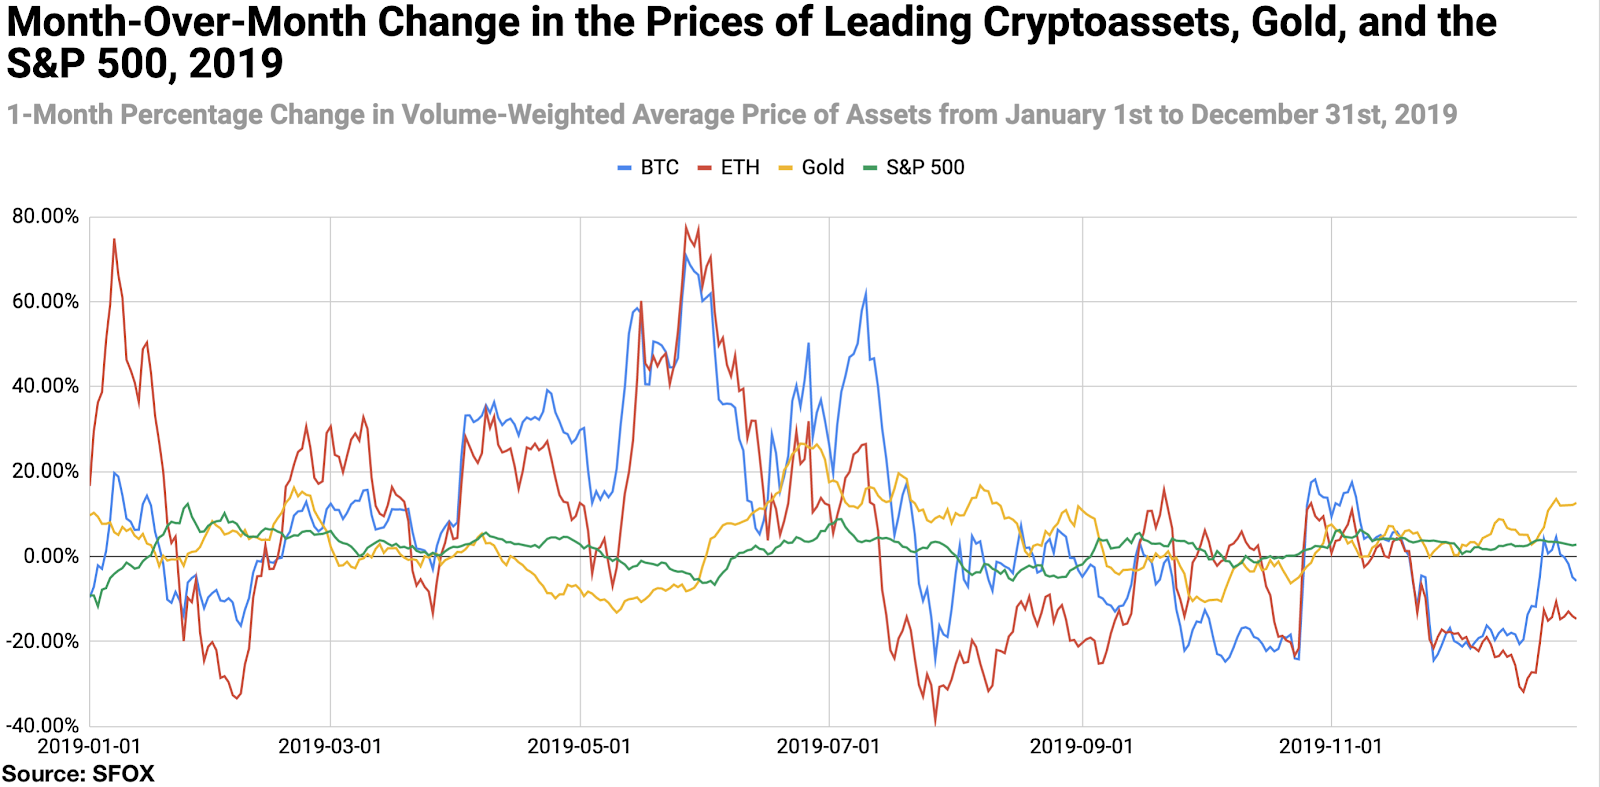
All leading cryptoassets except for Ethereum Classic showed month-over-month (MoM) losses at the end of 2019. ETC showed 14.63% MoM returns; meanwhile, BTC showed a MoM loss of -5.74%, while ETH showed the most significant MoM losses at -14.63%. In traditional markets, gold showed MoM gains of 12.63% and the S&P 500 showed MoM gains of 2.81%.
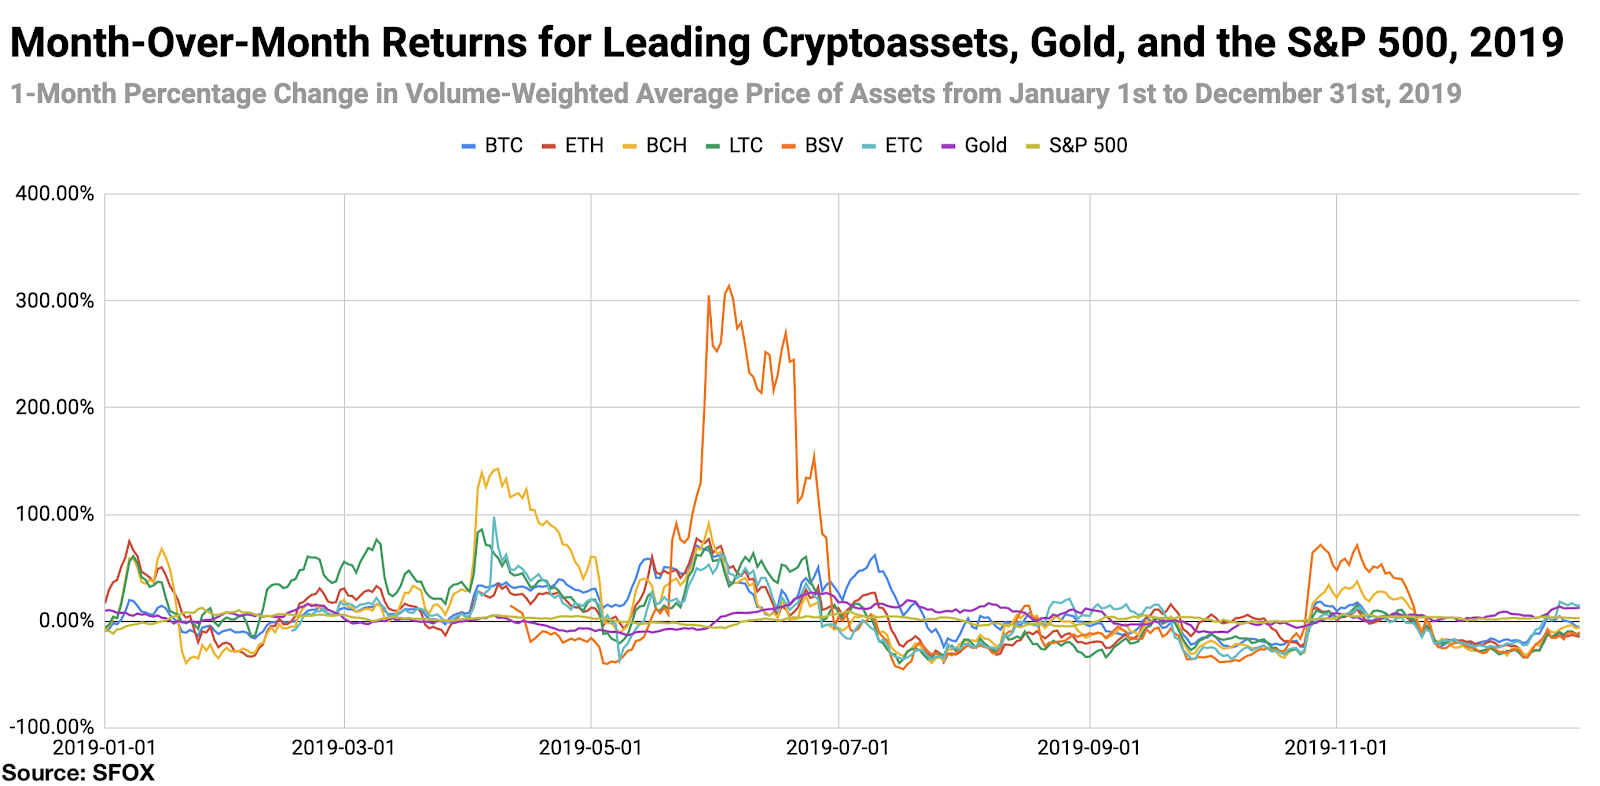
For greater graphical clarity, see this additional chart tracking only the month-over-month changes in the prices of BTC, ETH, gold, and the S&P 500:
Volatility: Climbing Only to Descend
By looking at the 30-day historical volatilities of BTC, ETH, BCH, LTC, BSV, and ETC, we see that general crypto volatility decreased at the beginning of 2019, ramped up in the middle of the year, and decreased near the year’s end. BTC’s volatility began 2019 at 70.21%, fell to 17.86% by April 1st, climbed to 102.53% by July 20th, and fell to 32.05% by the end of December.
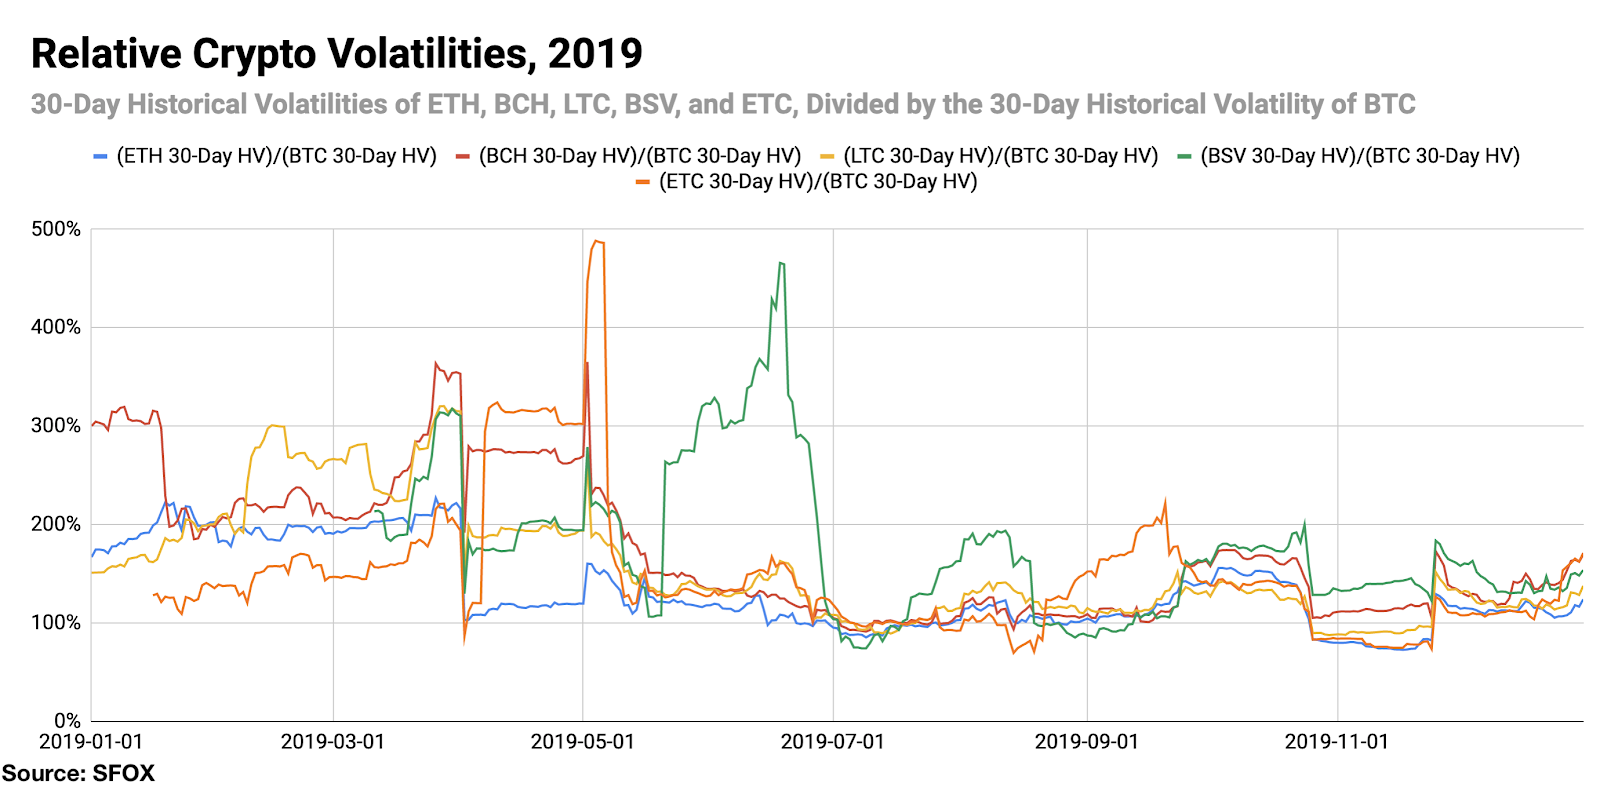
By looking at the 30-day historical volatilities of ETH, BCH, LTC, BSV, and ETC as a percentage of BTC’s 30-day historical volatility, we can see that altcoins experienced several sharp spikes in volatility independent of BTC’s movements throughout the year. At a glance, BSV and ETC appear to be the standouts in terms of large, BTC-independent volatility fulctuations.
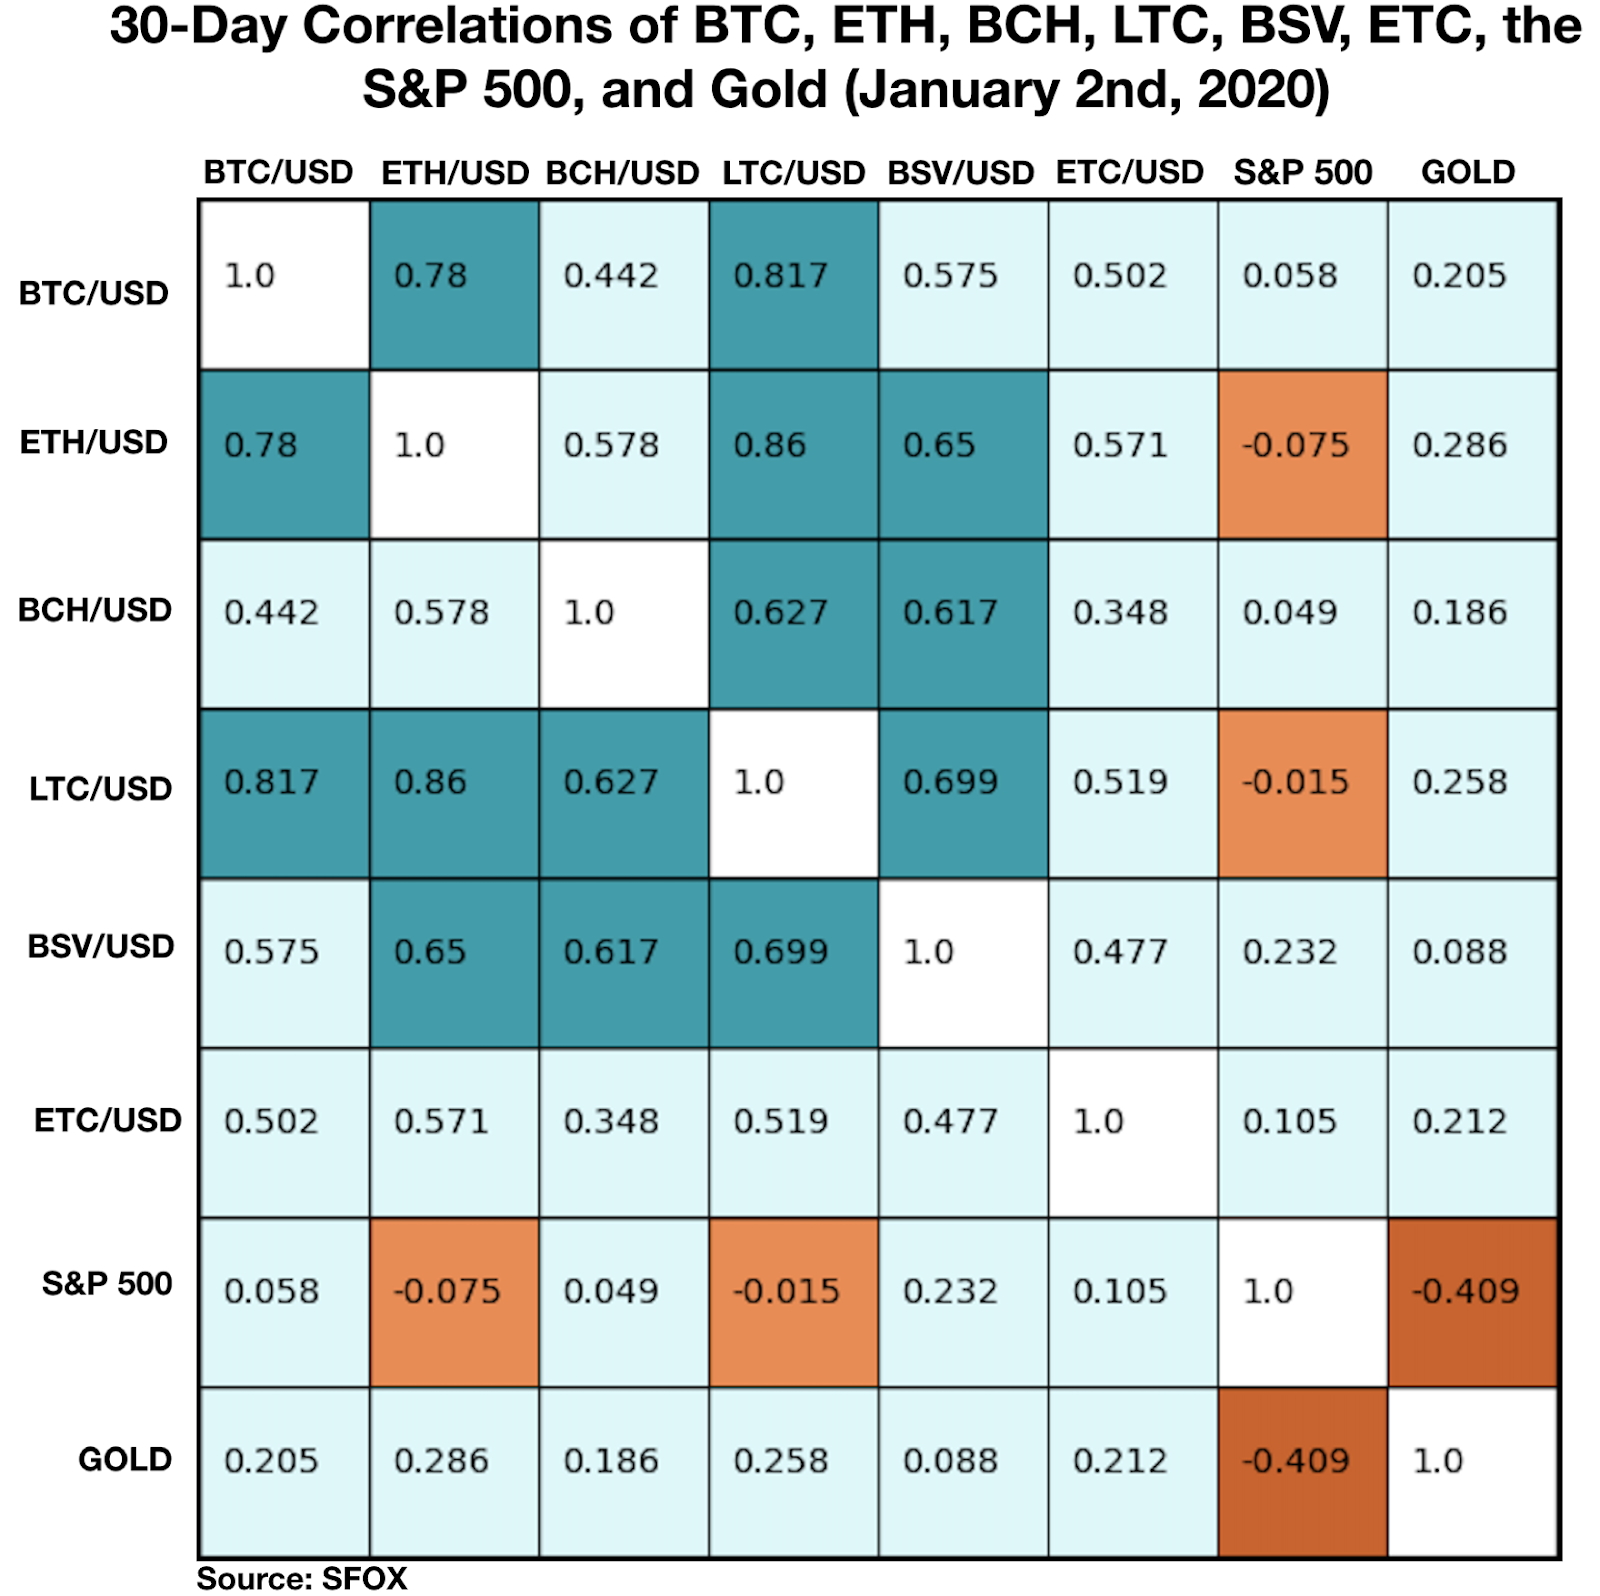
Price Correlations: Unexpectedly Low Crypto Correlations
The most recent crypto correlations data show that BTC has a much lower positive correlation with BCH, BSV, and ETC than typical. Whereas these correlations have been as high as 0.8 or 0.9 in the past, they are all currently between 0.4 and 0.6. These correlations began to dip around the 20th of December; whether these altcoins will continue to be less correlated with BTC into 2020 remains to be seen. All cryptoassets remain largely uncorrelated with gold and the S&P 500.
See the full SFOX crypto correlations matrix below:
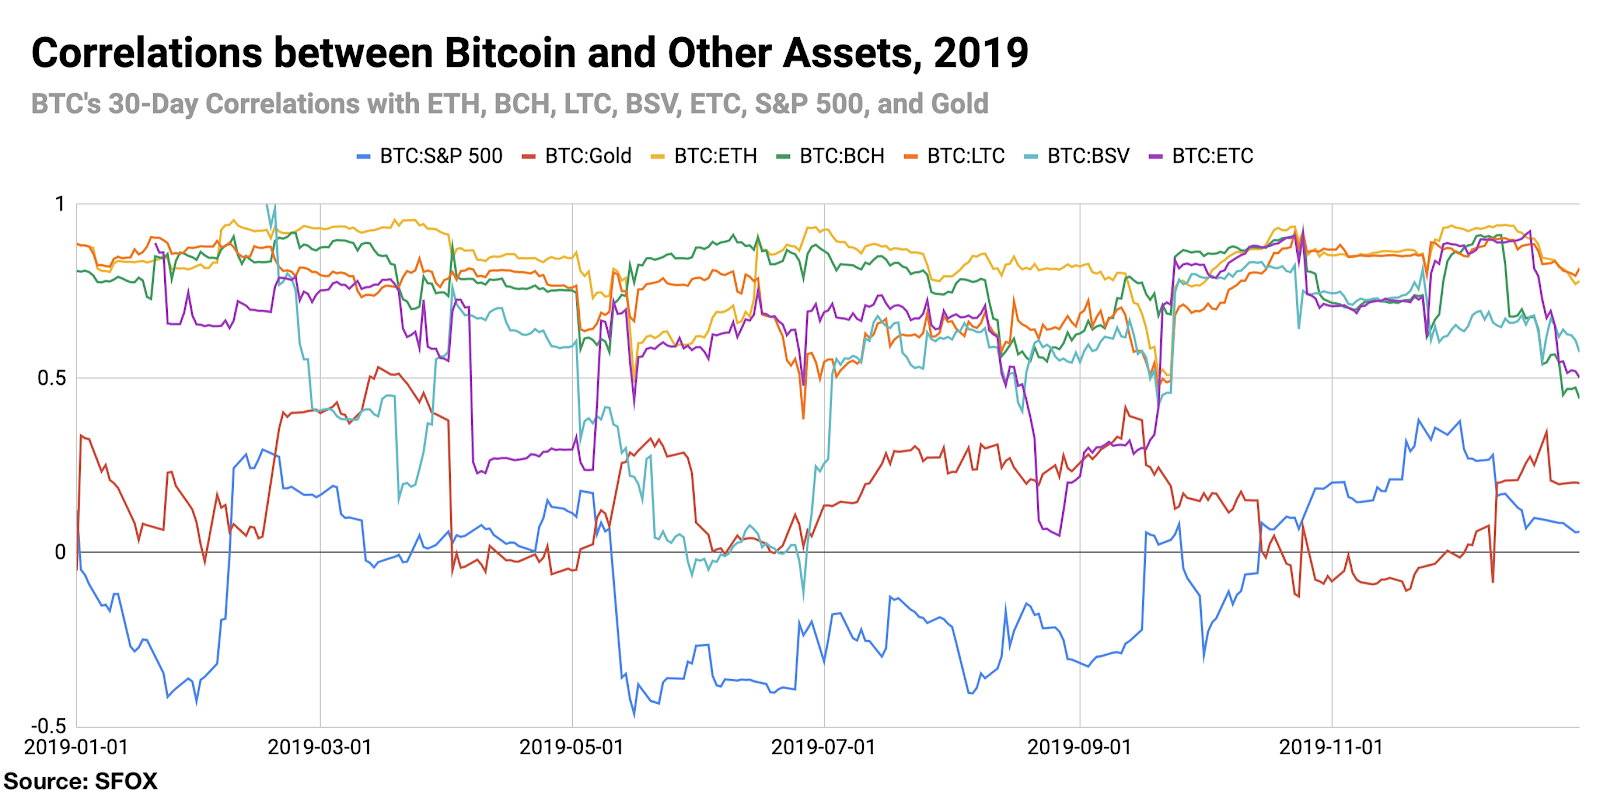
For a more complete look at BTC’s correlations with other assets throughout the past year, see the following graph:
Appendix: Data Sources, Definitions, and Methodology
All cryptocurrency prices are denominated in USD unless otherwise noted.
Note that data collection for ETC began on January 16th, 2019, and data collection for BSV began on March 11th, 2019; therefore, this report does not reflect a full year of data for these two cryptoassets.
We use two different in-house volatility indices in creating these reports:
1. 30-day historical volatility (HV) indices are calculated from daily snapshots over the relevant 30-day period using the formula:
30-Day HV Index = σ(Ln(P1/P0), Ln(P2/P1), …, Ln(P30/P29)) * √(365)
2. Daily historical volatility (HV) indices are calculated from 1440 snapshots over the relevant 24-hour period using the formula:
Daily HV Index = σ(Ln(P1/P0), Ln(P2/P1), …, Ln(P1440/P1439))* √(1440)
S&P 500 performance data are collected from Yahoo! Finance using GSPC (S&P 500 Index) data. Gold performance data are collected from Yahoo! Finance using XAU (Philadelphia Gold and Silver Index) data.
30-day asset correlations are calculated using the Pearson method, in accordance with the following formula:
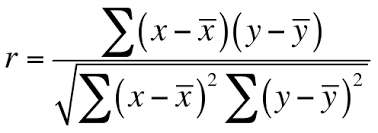
In our calculations, x = 30-day returns for BTC/USD, y = 30-day returns for the other asset in consideration, and r = the correlation coefficient between BTC and the other asset in consideration.
The cryptoasset data sources aggregated for crypto prices, correlations, and volatility indices presented and analyzed in this report are the following eight exchanges, the order-book data of which we collect and store in real time:
- bitFlyer
- Binance
- Bitstamp
- Bittrex
- Coinbase
- Gemini
- itBit
- Kraken
Our indices’ integration of data from multiple top liquidity providers offers a more holistic view of the crypto market’s minute-to-minute movement. There are two problems with looking to any single liquidity provider for marketwide data:
- Different liquidity providers experience widely varying trade volumes. For example: according to CoinMarketCap, Binance saw over $20 billion USD in trading volume in November 2018, whereas Bitstamp saw $2 billion USD in trading volume in that same time — an order-of-magnitude difference. Therefore, treating any single liquidity provider’s data as representative of the overall market is myopic.
- Liquidity providers routinely experience interruptions in data collection. For instance, virtually every exchange undergoes regularly scheduled maintenance at one point or another, at which point their order books are unavailable and they therefore have no market data to collect or report. At best, this can prevent analysts from getting a full picture of market performance; at worst, it can make it virtually impossible to build metrics such as historical volatility indices.
Building volatility indices that collect real-time data from many distinct liquidity providers mitigates both of these problems: collecting and averaging data from different sources prevents any single source from having an outsized impact on our view of the market, and it also allows us to still have data for analysis even if one or two of those sources experience interruptions. We use five redundant data collection mechanisms for each exchange in order to ensure that our data collection will remain uninterrupted even in the event of multiple failures.
The above references an opinion and is for informational purposes only. It is not intended as and does not constitute investment advice, and is not an offer to buy or sell or a solicitation of an offer to buy or sell any cryptocurrency, security, product, service or investment. Seek a duly licensed professional for investment advice. The information provided here or in any communication containing a link to this site is not intended for distribution to, or use by, any person or entity in any jurisdiction or country where such distribution or use would be contrary to law or regulation or which would subject SFOX, Inc. or its affiliates to any registration requirement within such jurisdiction or country. Neither the information, nor any opinion contained in this site constitutes a solicitation or offer by SFOX, Inc. or its affiliates to buy or sell any cryptocurrencies, securities, futures, options or other financial instruments or provide any investment advice or service.