
Bitcoin Remains Hopeful amid Crypto Correction
Sushi, Kimchi, and Hot Dogs: Crypto went full foodie mode last week amid the uniswap forks craze while Bitcoin (BTC) and the main currencies suffered a correction, sending mixed signals to traders.
The DeFi (Decentralized Finance) craze, intrinsically connected to Ethereum’s (ETH) rally since July 16, led newly launched protocols like yearn.finance (YFI) and Aave (LEND) to generate cumulative returns of 306.2% and 84.3%, respectively over that period.
Many profited from the price surges of these short-lived protocols promising 2000% APYs that ultimately led many to succumb to losses of over 80%.
Crypto’s recovering from the second-worst day of the year.
While new forks sprang from every side, Bitcoin suffered the second-biggest daily loss of the year on Sep. 3, only preceded by the Mar. 12 madness that evaporated markets worldwide, declining 10.8%. Following Bitcoin’s downtrend, currencies available for trading on SFOX such as Bitcoin Cash (BCH), Bitcoin SV (BSV), Ethereum, Ethereum Classic (ETC), Litecoin (LTC), and Ravencoin (RVN) also had one of the worst daily performances on Sep. 3, retracing between 10% and 20%.
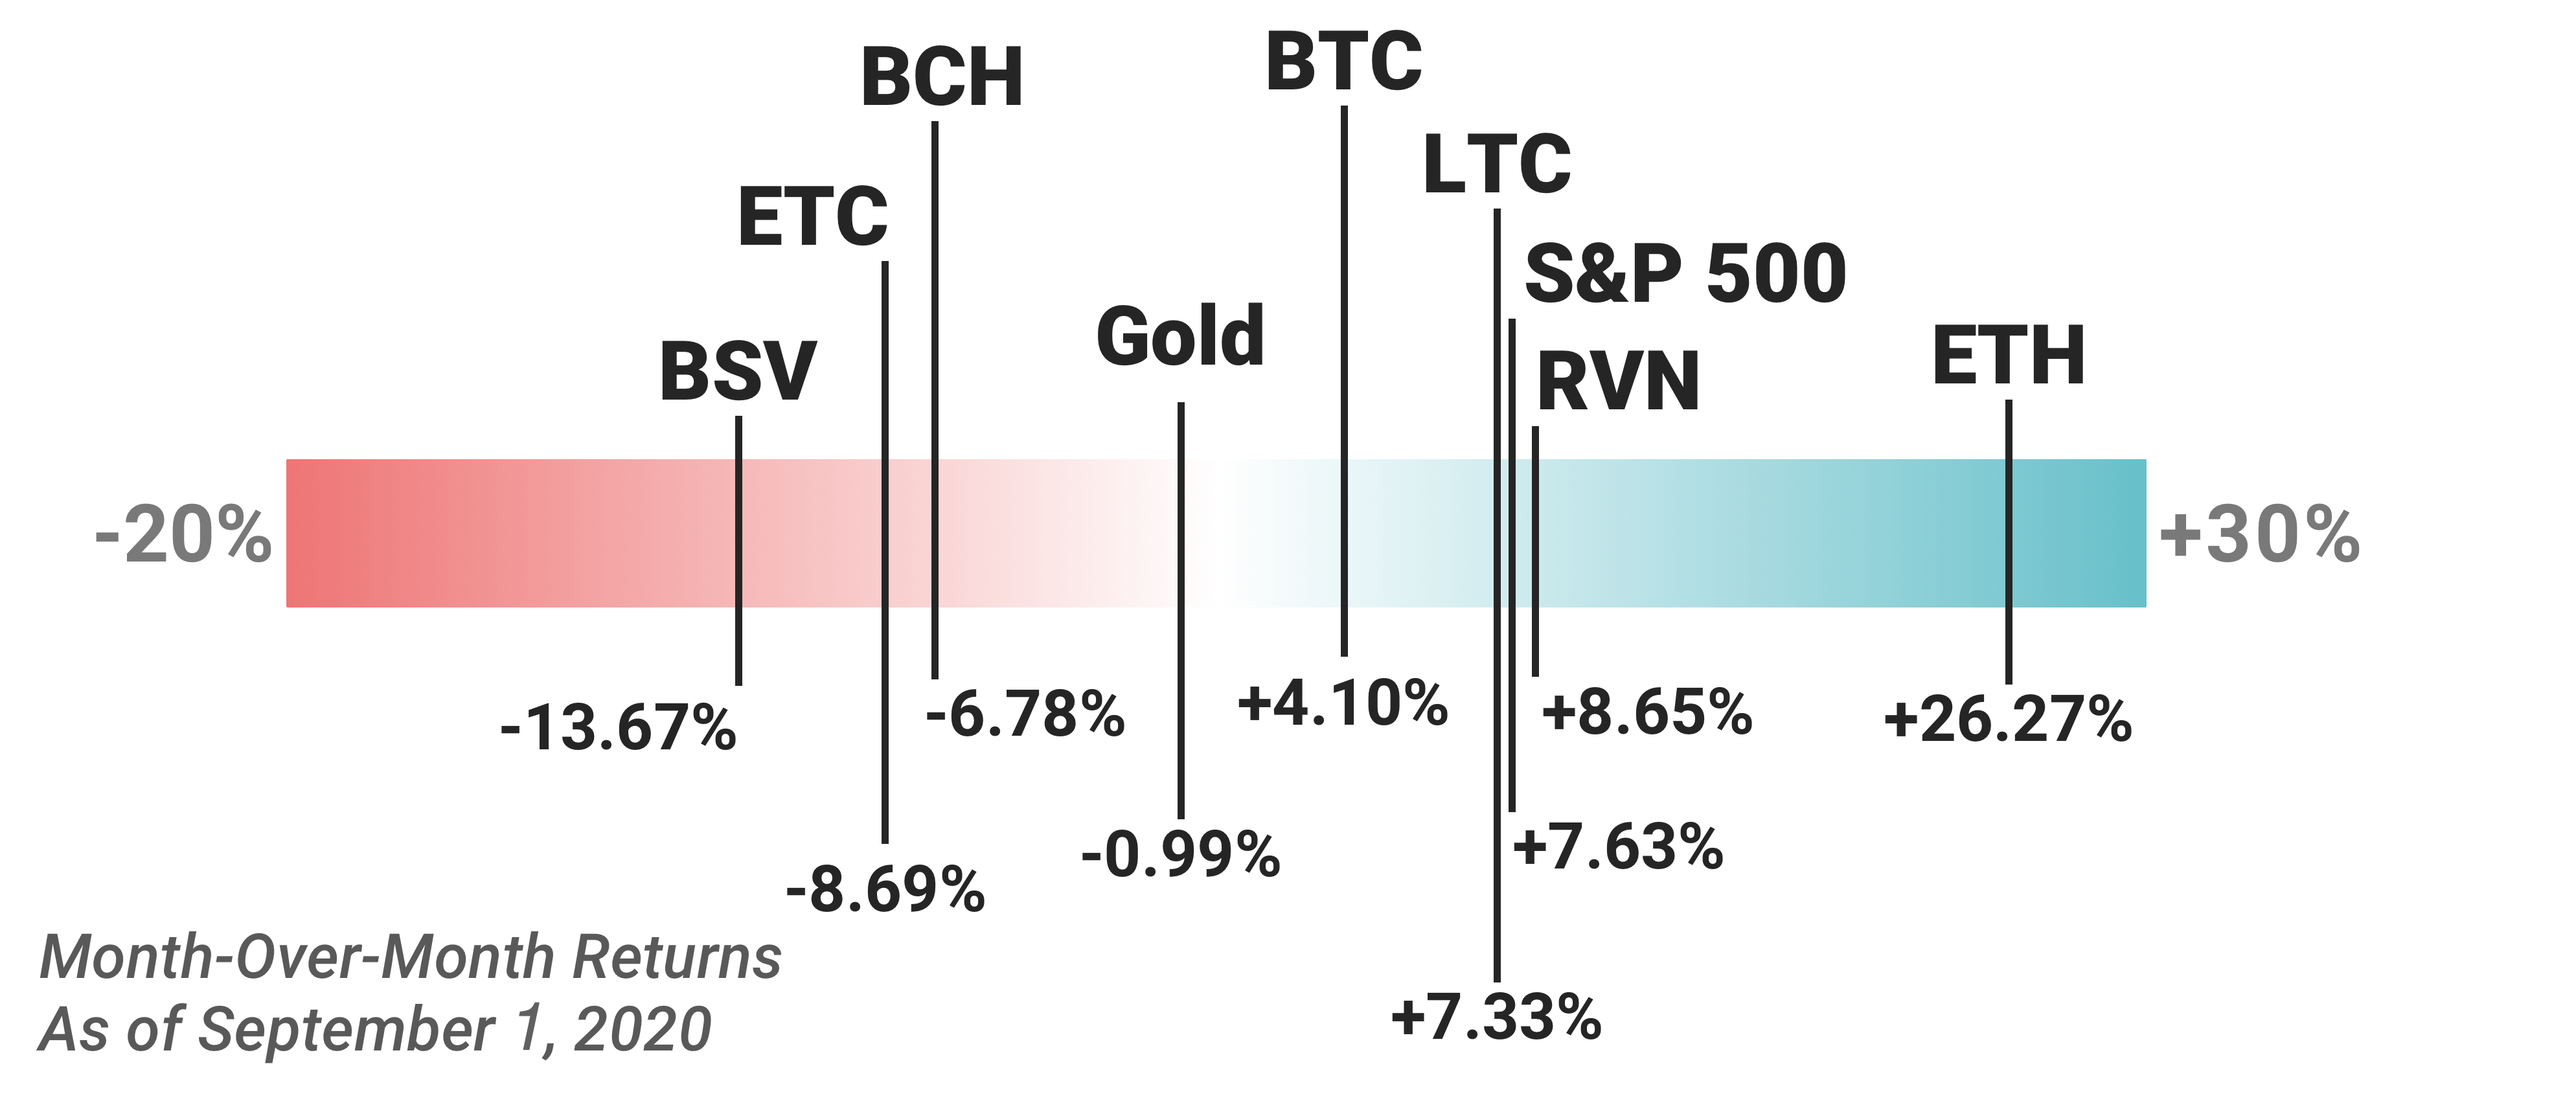
Nevertheless, in August, Bitcoin, Litecoin, Ethereum, and Ravencoin managed to generate a positive return. September’s Volatility report showed the recovery of some currencies, suggesting that not all hopes are lost and that ”crypto winter” may still be far away.
As markets move sideways, traders should be aware of key price levels while looking at key indicators that reveal the state of networks to make educated decisions.
Get the SFOX edge in volatile times through our smart-routing order types that capture the best available crypto prices from all major trading venues directly from your SFOX account.
Bitcoin past through bearish shadows? A Technical Approach
Bitcoin currently hovers around $10,660, slightly below its 20-EMA price ($10727) and above its 100-day moving average ($10,327), recovering from the $10K level test in the last few days.
Last week, the main concern was the CME gap set in late July, between the $9,670-$9,930 range, which historically has a very high chance of being filled. The cross between the 20-days moving average line and the 50-days MA suggested that the gap could be close, has since turned into a more neutral stance.
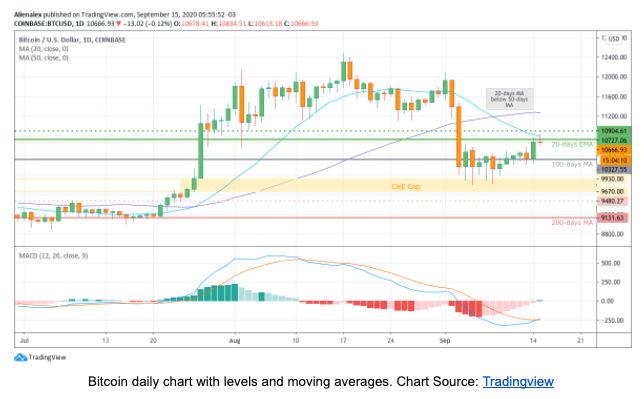
In the short-term, traders should look for the levels around the 20-days EMA price that could prove definitive for Bitcoin to regain $11K. In the case of a retracement in the next few days, traders should be aware of the $10K-$10.3K range, which can rekindle the CME gap threats. If the gap fills, it could trigger a deeper downtrend challenging $9.1K in the short-term, a key support level based on the 200-days moving average.
A neutral stance replaced extreme greed levels on the market, reflecting the overall uncertainty for Bitcoin’s short-term behavior. Meanwhile, the state of the network reveals a healthy condition with a new hash rate record set at 150.9 EH/s, while mining profitability is on a downtrend, augmenting the price predictions’ doubts.
In the short-term, traders should look for the levels around the 20-days EMA price that could prove definitive for Bitcoin to regain $11K. In the case of a retracement in the next few days, traders should be aware of the $10K-$10.3K range, which can rekindle the CME gap threats. If the gap fills, it could trigger a deeper downtrend challenging $9.1K in the short-term, a key support level based on the 200-days moving average.
Bitcoin Cash mimics Bitcoin in the short-term.
The price reaction of Bitcoin forks like Bitcoin Cash and Bitcoin SV is similar due to the traditionally high relationship, confirmed by the high correlations spotted last month.
As expected, Bitcoin Cash’s last days’ behavior is very similar to Bitcoin with indicators like the MACD and RSI, suggesting the same short-term recovery pattern moving ahead. BCH’s price currently sits around $234, while staying below its 100-days moving average ($254.44) and its 200-days MA ($248.01).
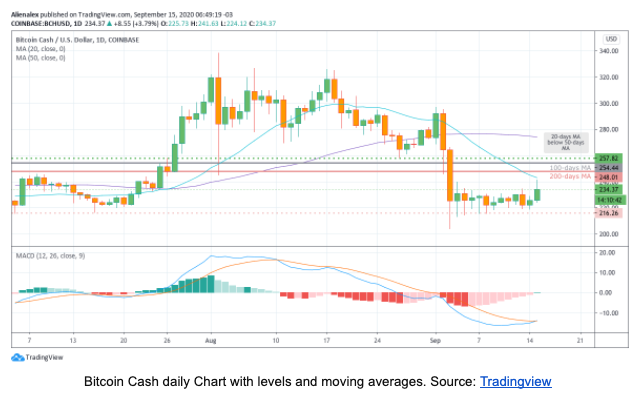
Investors should look for the longer-term MA prices, which could trigger a short-term increase to over $257. A reversal could trigger BCH to the $216 levels or enter a previously dangerous level ($200), mimicking the March crash.
Bitcoin SV gives glimpses of hope.
At the same time, Bitcoin SV is showing a short-term price recovery at $164 with the MACD and the RSI proposing a positive short-term reversal amid hopes of reclaiming the 100-days moving average price ($188.2), breaking from Bitcoin. Nevertheless, the 20 days MA crossed the longer-term MA lines (200-days), sending mixed signals regarding the short-term action.
Ethereum: 2020’s darling saves the day?
Ethereum surged after the March crash, surpassing Bitcoin to become one of the best-performing assets of the year. In the last month, the lower correlation with Bitcoin reflects the difference in behavior. Ethereum currently sits at $372, testing its 20-days EMA price ($378.69) and quite above its 100-days MA line ($315.47).
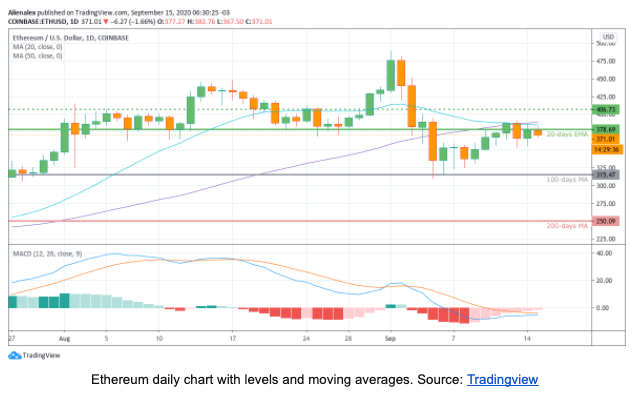
The 20-days MA line just crossed the 50-days MA line, which could suggest a gloomy outlook, but both lines show an uncertain trend amid the recent price recovery. Pointing to a positive outlook, the MACD recovered while the RSI shook-off the oversold levels to a more neutral range.
Traders on SFOX should look for a close above the 20-days EMA price ($378), which could lead Ethereum to retest the $400 barrier. A failure to recover the first upwards step could lead a sideways movement around $350, paying close attention to lower support levels ($315).
Ethereum fork trying to break stiff resistance
Ethereum Classic currently sits at $5.98, below the 20-days EMA price ($6.123) and long-term moving average prices (100 days and 200-days). The MACD is already on the positive side, suggesting a short-term recovery, but repeatedly failing to cross the $6.38 level in the last days.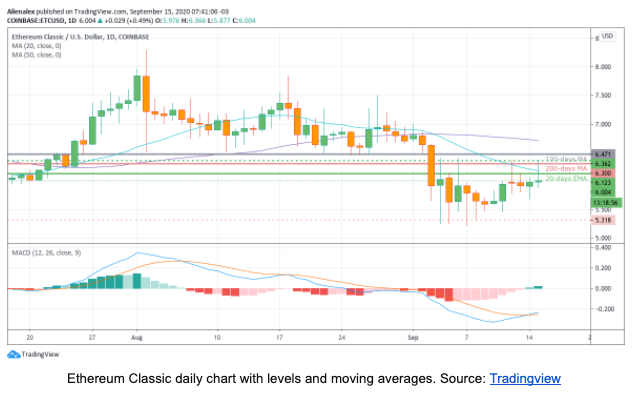
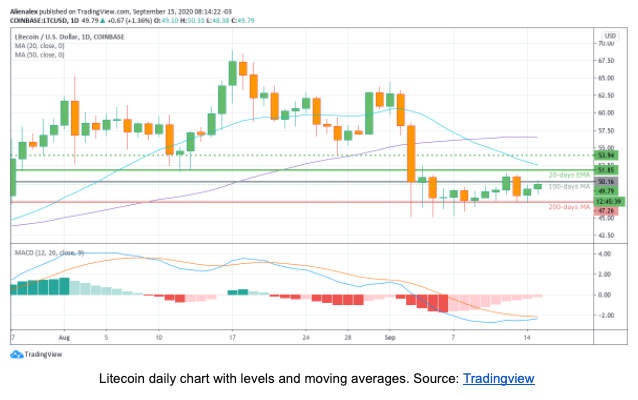
Widespread short-term recovery in crypto.
High market capped currency, Litecoin, currently hovers around 49.79$, slightly below its 100-days and above its 200-days MA prices while testing the 20-days EMA area (51.85$).
Recently the 20-days MA line crossed below the 50-days MA line, indicating a possible future short-term price decline, but the recent price recovery goes hand-to-hand with RSI shift to a more neutral level from the highest oversold levels since late-March.
As a result, LTC’s next price target sits around its 20-days EMA level (51.85$), supported by the increasing MACD trend in the short-term. On the negative side, traders should pay attention to the 200-days MA level (47.26$), which could trigger a descent to 45$.
Smaller currencies like Ravencoin, currently resting at $0.01713, showed a recent shy increase as other currencies, with the prevalent indicators (e.g., MACD) suggesting a short-term hike, possibly eying the $0.02 target.
Global markets correct from yearly highs.
Since the beginning of the month, stock markets worldwide are on a descending trend while gold, the prime safe-haven, has been on a longer downwards curve after records were beaten week after week.
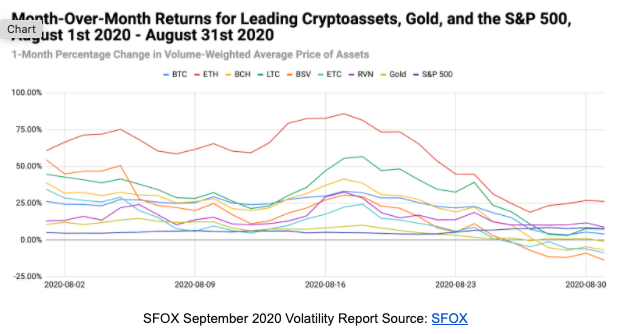
Bitcoin and crypto were no exception as the digital safe-haven corrected from yearly-high following its physical counterpart on the descending trend, as seen by the month-over-month return analysis published on our last report.
In the short future, investors can expect increases to occur in the leading cryptocurrencies with some oscillations while testing key levels that will determine longer-term outlooks. Bitcoin’s long-term ascending trend after each halving still suggests an optimistic outlook.
In such challenging scenarios, even experienced traders need an extra advantage to generate superior returns. SFOX gives you the best entry prices, helping you to conduct profitable investment strategies while sharing regular technical insights.
Appendix
All crypto pairs were against the US Dollar from Coinbase as reference except for the BSV/USD pair (from Bitfinex) and the RVN/USD pair (from Bittrex). Cumulative Returns computations based on closing price data from coinmarketcap.com
Disclosure: The above references an opinion and is for informational purposes only. It is not intended as and does not constitute investment advice, and is not an offer to buy or sell or a solicitation of an offer to buy or sell any cryptocurrency, security, product, service or investment. Seek a duly licensed professional for investment advice. The information provided here or in any communication containing a link to this site is not intended for distribution to, or use by, any person or entity in any jurisdiction or country where such distribution or use would be contrary to law or regulation or which would subject SFOX, Inc. or its affiliates to any registration requirement within such jurisdiction or country. Neither the information, nor any opinion contained in this site constitutes a solicitation or offer by SFOX, Inc. or its affiliates to buy or sell any cryptocurrencies, securities, futures, options or other financial instruments or provide any investment advice or service.