Summary:
- The SFOX Multi-Factor Market Index has been upgraded from Mildly Bullish to Neutral as of September 1st, 2020.
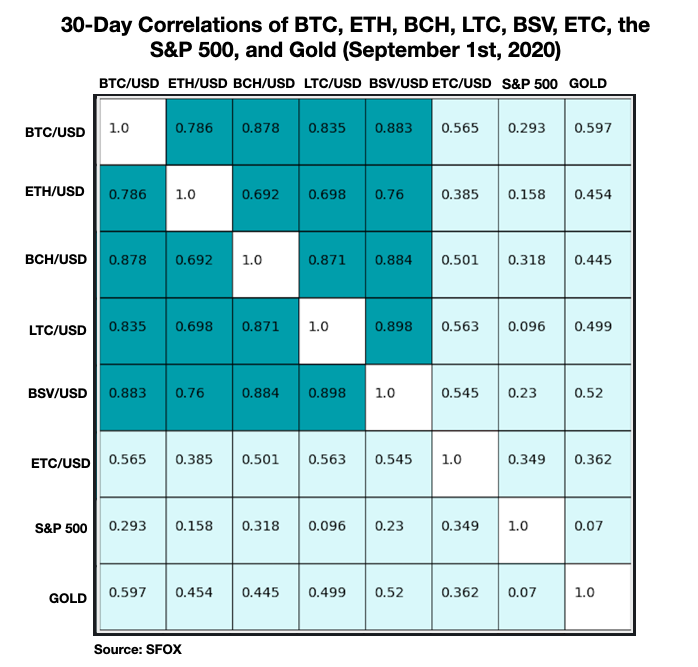
- ETH saw an atypically low correlation with other cryptocurrencies, including BTC.
- The month of August showed that bitcoin’s volatility is not a thing of the past. While the currency started off on a high note of $11,800, things moved around between the low and mid-$11,000 ranges after it was announced that inflation would spike beyond 2%.
- While Bitcoin traveled shaky ground, the world of DeFi continued to expand, helping Ethereum (ETH) investors return to 85% month-over-month gains and currencies like Chainlink (LINK) more than doubling their prices. LINK now stands as the fifth-largest cryptocurrency by market cap.
- A few price setbacks aren’t enough to make large institutions forget about bitcoin, as Fidelity Investments produced documentation to the Securities and Exchange Commission (SEC) for a new fund devoted entirely to the world’s largest crypto asset.
- Both Chinese and American regulators have taken steps to penalize bad actors in the bitcoin space, suggesting that crypto players are never above the law… No matter how big or rich they get.
- Meanwhile, Ethereum 2.0 has suffered another setback after its public testnet Medalla was delayed, though a quick fix was in order.
In the September 2020 edition of the SFOX crypto market report, the SFOX Research Team reviews the crypto market’s volatility, correlations, and other performance metrics throughout the past month. We’ve aggregated price, volume, correlations, and volatility data from eight leading exchanges and liquidity providers to analyze the global performance of 7 major crypto assets — BTC, ETH, BCH, LTC, BSV, ETC, and RVN — all of which are available for smart-routing-powered trading on our trading platform.
The following is a report and analysis of their volatility, price correlations, and further development in the month of July and early August. (For more information on data sources and methodology, please consult the appendix at the end of the report.)
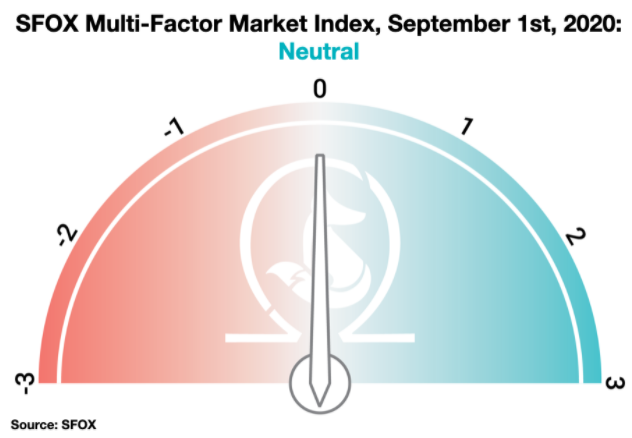
SFOX’s Current Crypto Market Outlook: Neutral
Based on our calculations and analyses, the SFOX Multi-Factor Market Index, which was set at mildly bullish a month ago, has been downgraded to neutral as of September 1st, 2020.
Based on our calculations and analyses, the SFOX Multi-Factor Market Index, which was set at mildly bullish a month ago, has been downgraded to neutral as of September 1st, 2020.
We determine the monthly value of this index by using proprietary, quantifiable indicators to analyze five market factors: price momentum, trade volume, market sentiment, volatility, and continued advancement of the sector. It is calculated using a proprietary formula that combines quantified, marketwide data on asset performance, search traffic, blockchain transactions, and more. The index ranges from highly bearish to highly bullish.
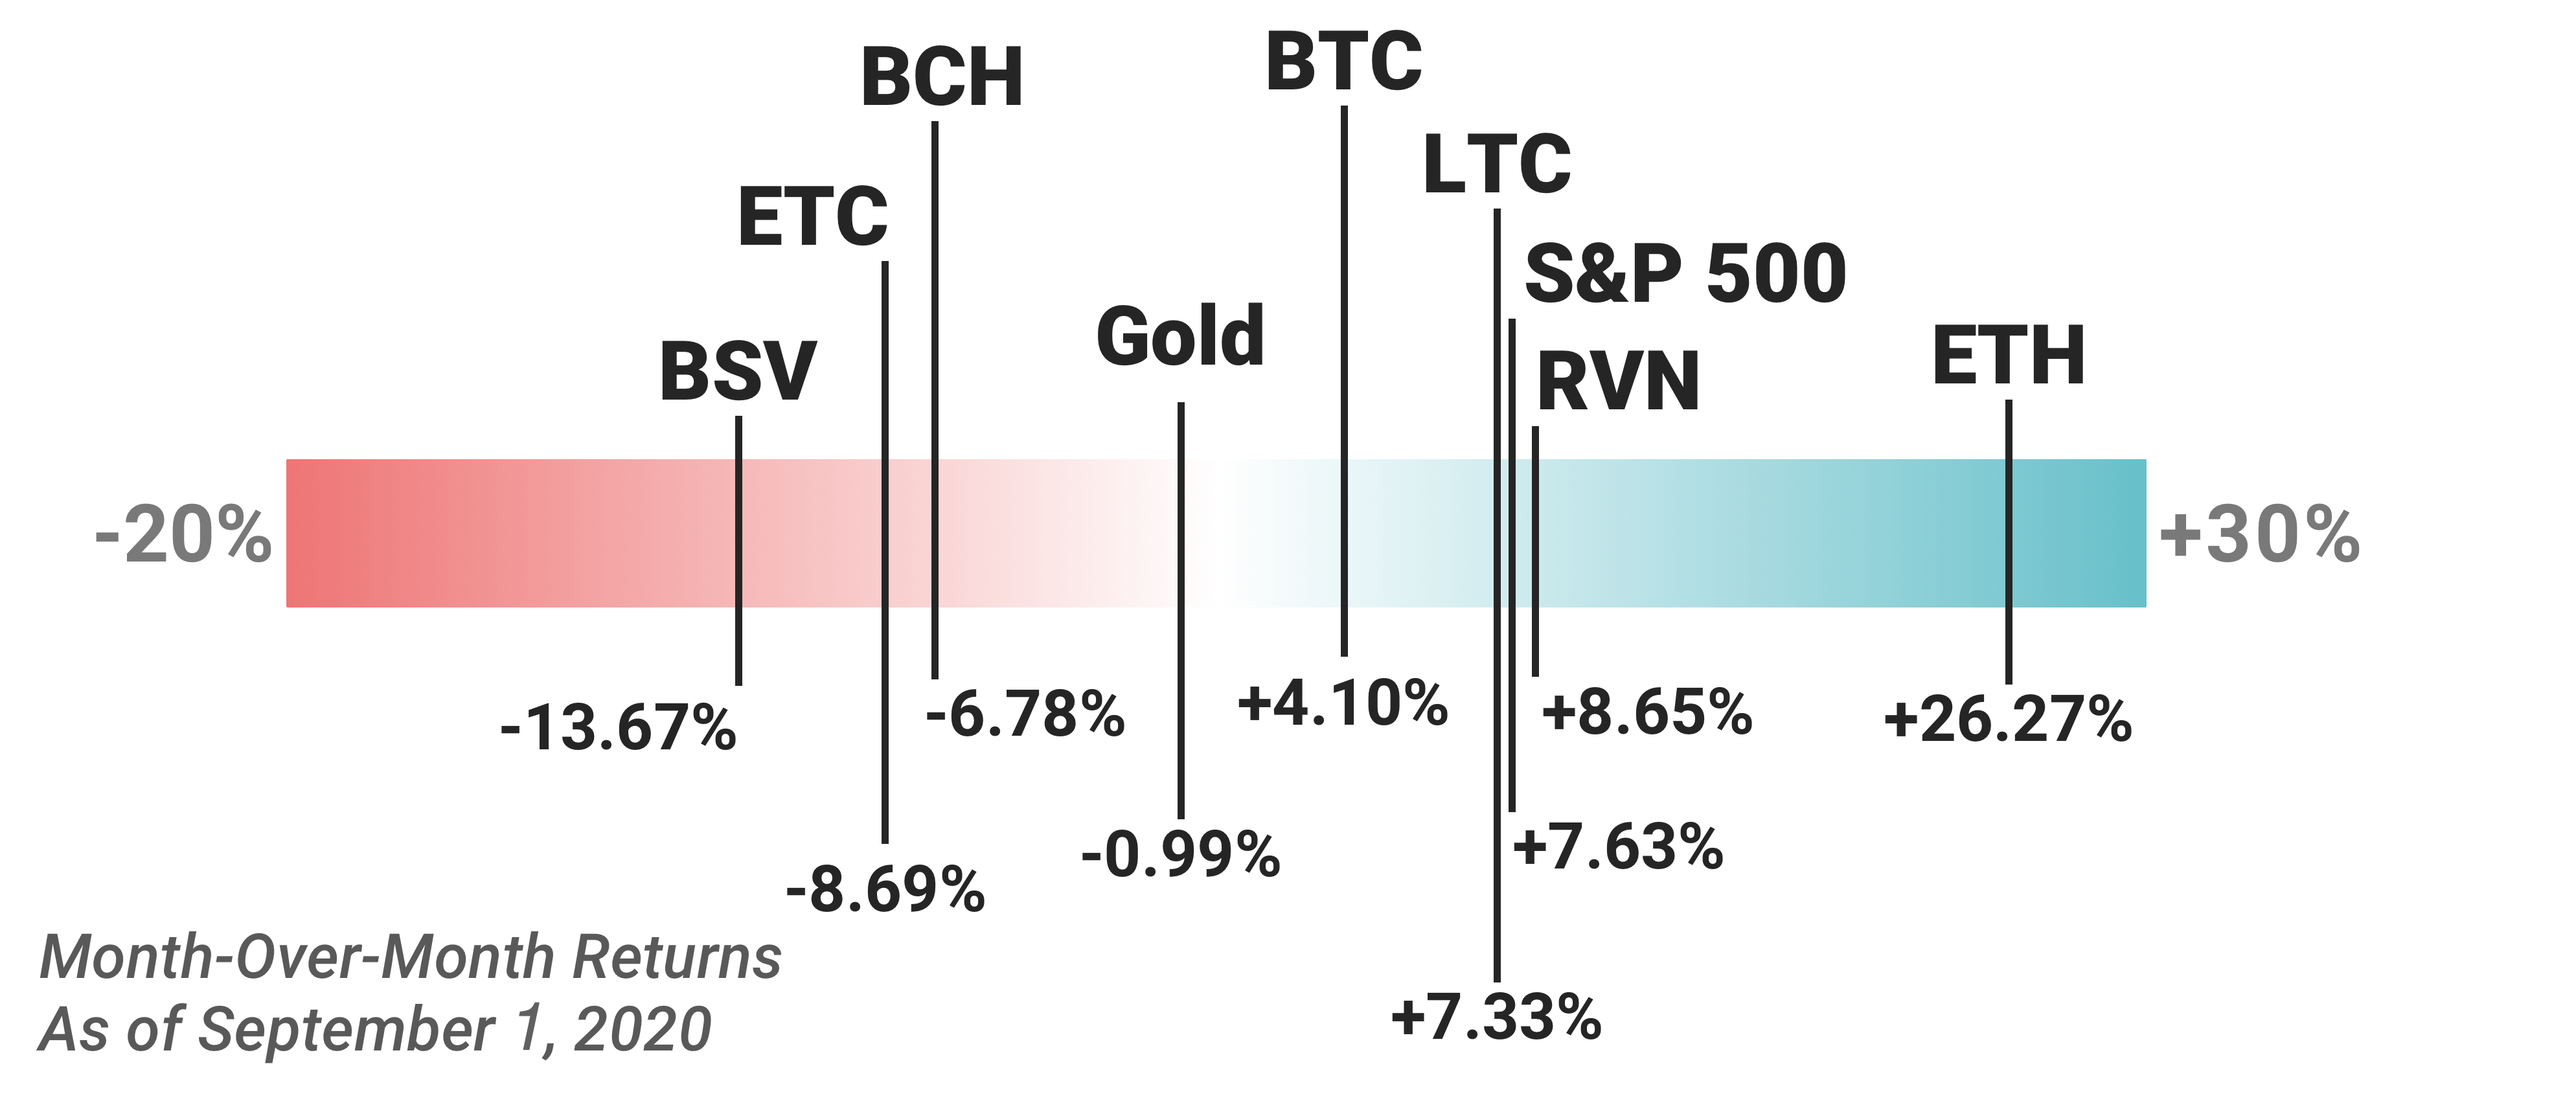
Some of the crypto assets available for trading on SFOX showed strong month-over-month gains as of September 1st. ETH, RVN, and the S&P had the highest month-over-month returns, respectively, while BSV had the largest loss at 13.67%. Among the crypto assets tracked by this report, ETH showed the greatest gains (26.27%), consistent with its relative performance over the last three months.
In a month where the major media cycle was bitcoin’s sustained breakout above $10000, the full story of the crypto sector, while bullish, seems to still be largely anticipatory. A large number of regulatory movements and increased action in the BTC futures market seem to mark expectations about further moves to come rather than fervor about the current state of the market; in particular, it seems as though some market participants may be keeping an eye on the potential for further institutional investment in crypto, an old refrain of the sector, on a more immediate horizon.
Get the SFOX edge in volatile times through our smart-routing order types that capture the best available crypto prices from all major trading venues directly from your SFOX account.
What’s Happened in the Last Month and What to Watch Next
Markets
BTC saw the month of August beginning on a high note with a surge to the $11,800 range that gave everyone an early taste for $12,000 (August 1st). The final moments of July saw Bitcoin going for only $11,337, though it then experienced a jump of more than 4% from one day to the next. The following morning, however, brought Bitcoin into relatively bearish territory, as traders saw the currency’s price fall to just over $11,070, meaning the world’s number one cryptocurrency had dropped by more than 6%.
Bitcoin would then lurch back into the $11,700 range by August 5th and surge beyond the $12,000 resistance mark on August 15th, hitting a price of roughly $12,300. However, the jump would not last, and Bitcoin fell back into the high $11,000 range the following day. From there, the currency spent the rest of the month on very volatile ground and meandered between the low and mid-$11,000 positions.
BTC remained on a relatively high pedestal throughout the month given that many traders and analysts view Bitcoin as a means of hedging wealth against inflation during the coronavirus pandemic. In the final week of August, Federal Reserve chair Jerome Powell announced that U.S. residents could expect to see inflation rise beyond 2%. The news spelled short-term doom for BTC, which fell into the low $11,000 range shortly after, though the currency later bounced back to $11,500. According to figures like Brad Garlinghouse—CEO of Ripple—a weakened U.S. dollar equals a stronger Bitcoin, meaning the asset could likely get even larger from here.
As the world of DeFi (decentralized finance) continues to grow, accolades for the month’s top coin should go to Chainlink (LINK), which rose more than 120% during the month of August to become the fifth-largest cryptocurrency by market cap (August 13th). Overtaking Bitcoin Cash, LINK now sits behind Bitcoin, Ethereum, Tether and Ripple and has made its way into the top five, garnering a market cap of more than $6 billion. The currency has more than doubled its price since the end of July, ending that month at $7.8 while bringing its price to $16.77 during the final days of August.
Products
Fidelity Investments has filed paperwork with the Securities and Exchange Commission (SEC) to let the organization know of a new fund devoted entirely to Bitcoin (August 26th). Known as Wise Origin Bitcoin Index Fund I, LP, the product will be available to professional and institutional traders only considering the minimum financial requirement to take part in the fund will be $100,000. The fund will be incorporated later this year and will operate out of Boston, Massachusetts.
The birth of the fund comes following an official survey conducted by Fidelity that showed more than 30% of institutional traders already taking part in the crypto industry. Another 60% said they were open to keeping digital currencies in their portfolios
Regulatory
China has penalized more than 20 Bitcoin and cryptocurrency mining farms—including those of giants like Bitmain—for providing false information about their companies’ statuses and intentions to gain access to energy benefits within the country’s Inner Mongolia region (August 28th). Several of the targeted enterprises sought to present themselves as big data or cloud-computing firms so they could take advantage of the region’s inexpensive electric power. Inner Mongolia’s Department of Industrial and Information Technology has since issued a statement explaining that the farms will be required to pay $0.015 more for every kilowatt hour utilized for mining crypto within the area. This, in turn, may lead to increased operational costs of more than $3,000 per day for the firms.
The IRS has shown that its straightforwardness on this year’s tax forms was no fluke, and that crypto traders should expect to be asked about their crypto activities on next year’s return as well (August 24th). Form 1040 will again contain a question asking if at any point during 2020 individuals received, traded or sold crypto, suggesting U.S. regulators are eager to better understand who holds crypto, how it works, and what people are using it for.
The United States has carried out the single-largest seizure of crypto funds owned by terrorists and terror organizations (August 25th). The Justice Department (DOJ) has issued a statement explaining that digital funds were taken from “al-Qassam Brigades, Hamas’s military wing, al-Qaeda, and Islamic State of Iraq and the Levant (ISIS).” Overall, approximately 300 separate cryptocurrency accounts containing several millions of dollars in digital funds were targeted, along with websites and Facebook pages that promoted terrorist funding under the
Technical Developments
Ethereum 2.0 suffered a heavy setback when its public testnet—known as Medalla—experienced a power blackout that resulted in several validators being temporarily taken offline (August 18th). While team members were able to fix the bug quickly and get things back up and running, the blackout came at a time when Ethereum 2.0 had already been suffering from several previous delays.
Raul Jordan—editor of Prysmatic Labs—insists that the incident is nothing to be concerned about, and that Ethereum 2.0 is still set to be released on time. However, he commented that Medalla had a very eventful weekend and that it “offered us the greatest learning experience to prevent this happening again, especially on mainnet.” He has further stated that the testnet is still alive and that participation has risen to a whopping 40%, though closer to 66% will be needed for the Ethereum 2.0 chain to become finalized.
The Details: Crypto Price, Volatility, and Correlation Data, August 1st – August 31st, 2020
Price Performance: Breakout
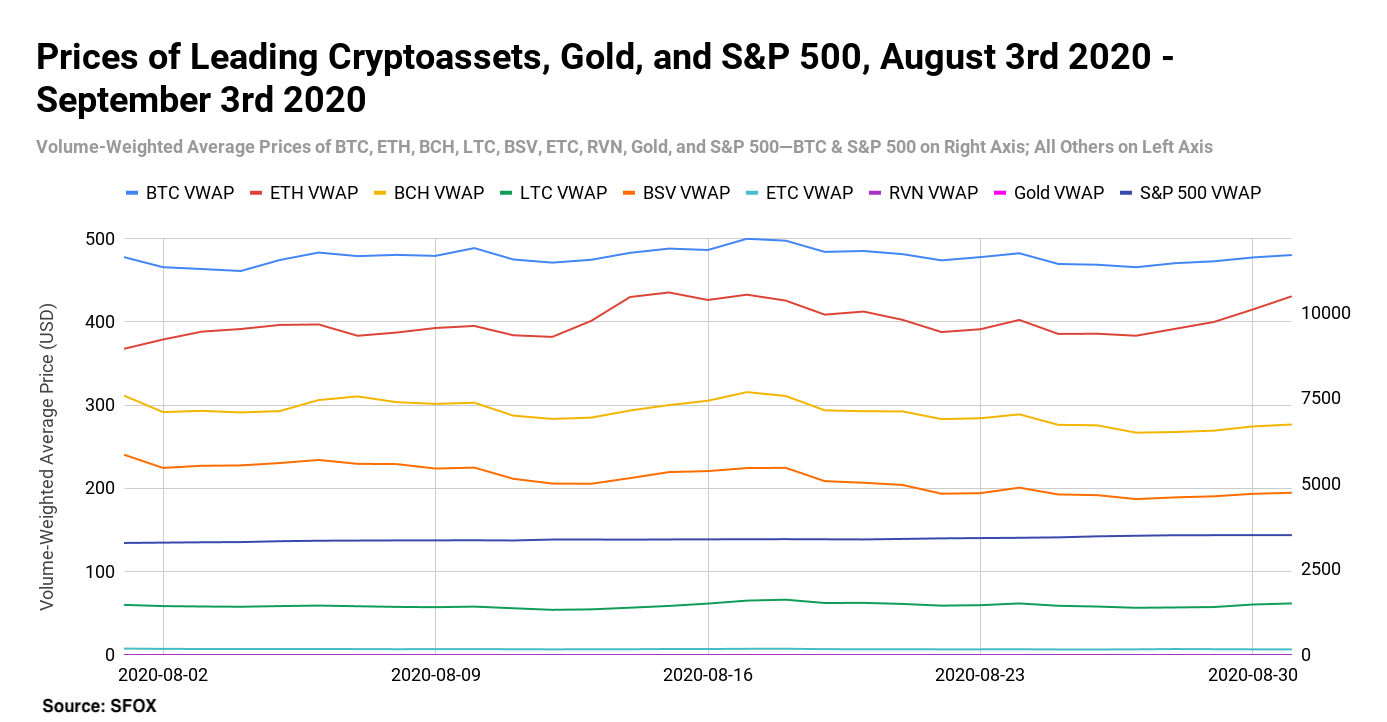
The volume-weighted average price of Bitcoin (BTC) started August at $11,630.47; BTC’s VWAP broke through the $12,000 level on August 17th , but retreated back to $11,691.80 August 31st. By this time, the announcement by Fed chair Jerome Powell that inflation would increase beyond 2% had taken a negative toll on bitcoin and financial markets everywhere, though e-Toro analyst Simon Peters later commented that inflation could potentially help BTC in the long run. Ripple head Brad Garlinghouse concurred, commenting that a weak U.S. dollar usually meant greater strength for bitcoin.
For better visibility of ETC and RVN price movements, please consult the following graph:
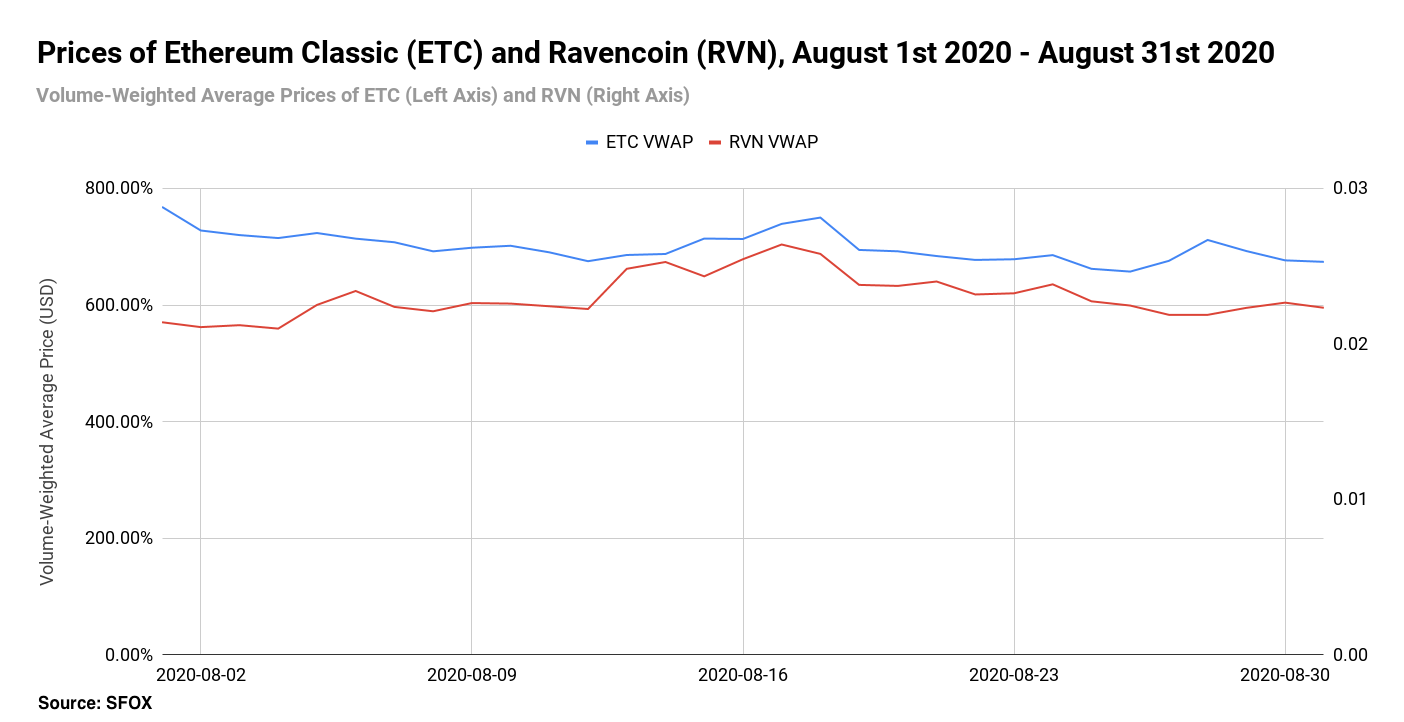
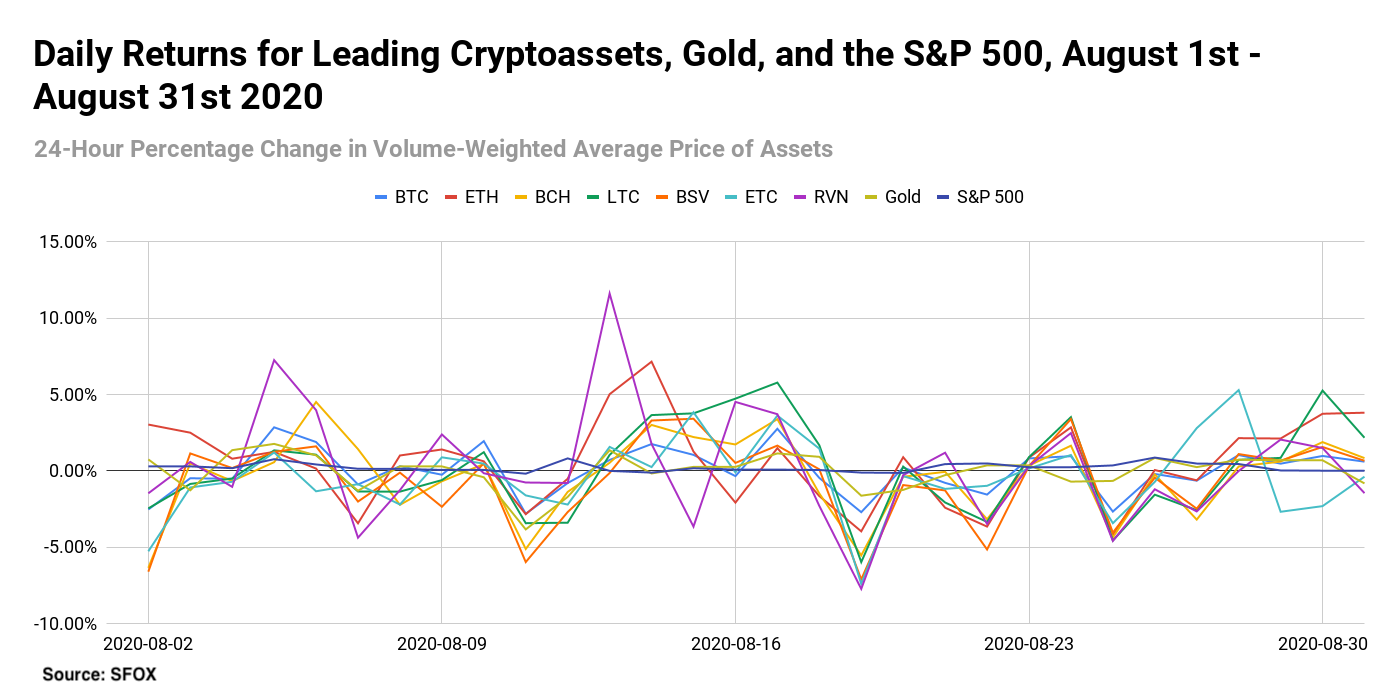
While some assets tracked by SFOX’s report saw positive daily gains, RVN stood out as outliers for the highest double-digit single-day gain: RVN gained 11.62% on August 13th, and ETC saw the largest at 7.40% on August 17th. These gains are unique in that early August witnessed a hack on Ravencoin that allowed cyber thieves to create, then steal as much as $6 million in RVN. ETC, on the other hand, was subjected to two 51% attacks.
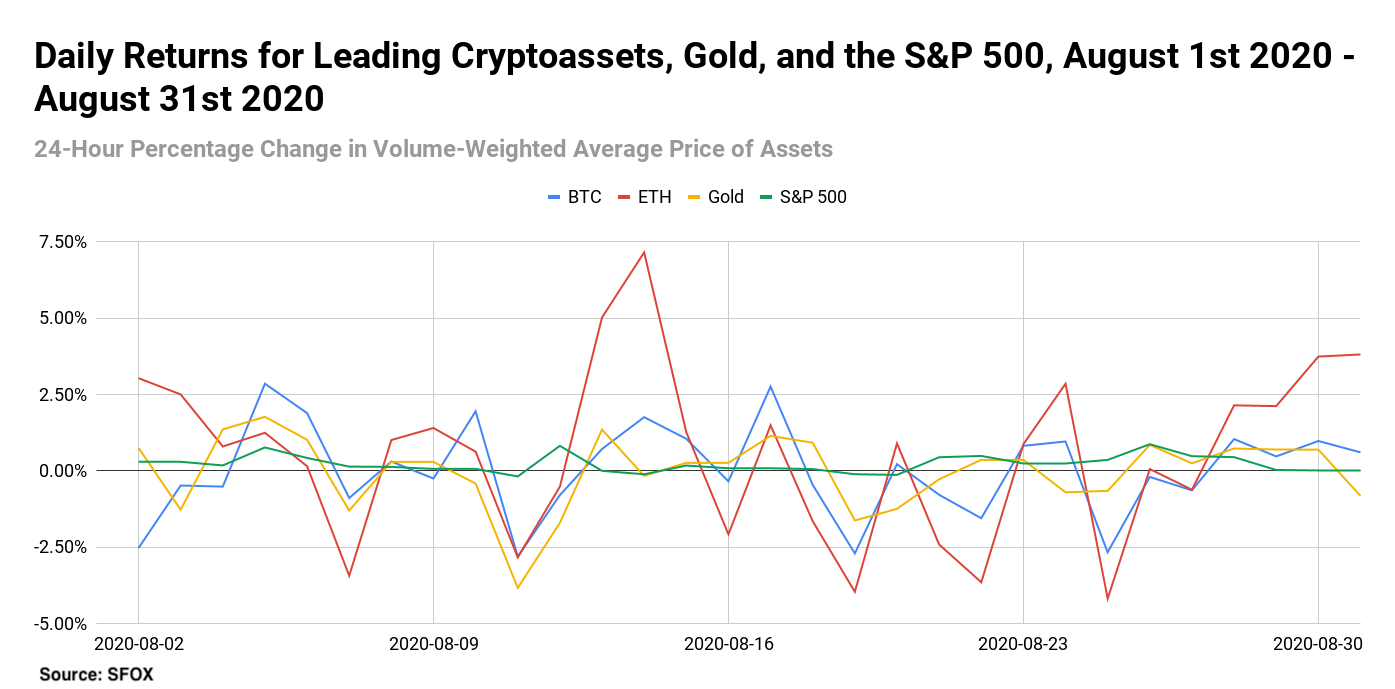
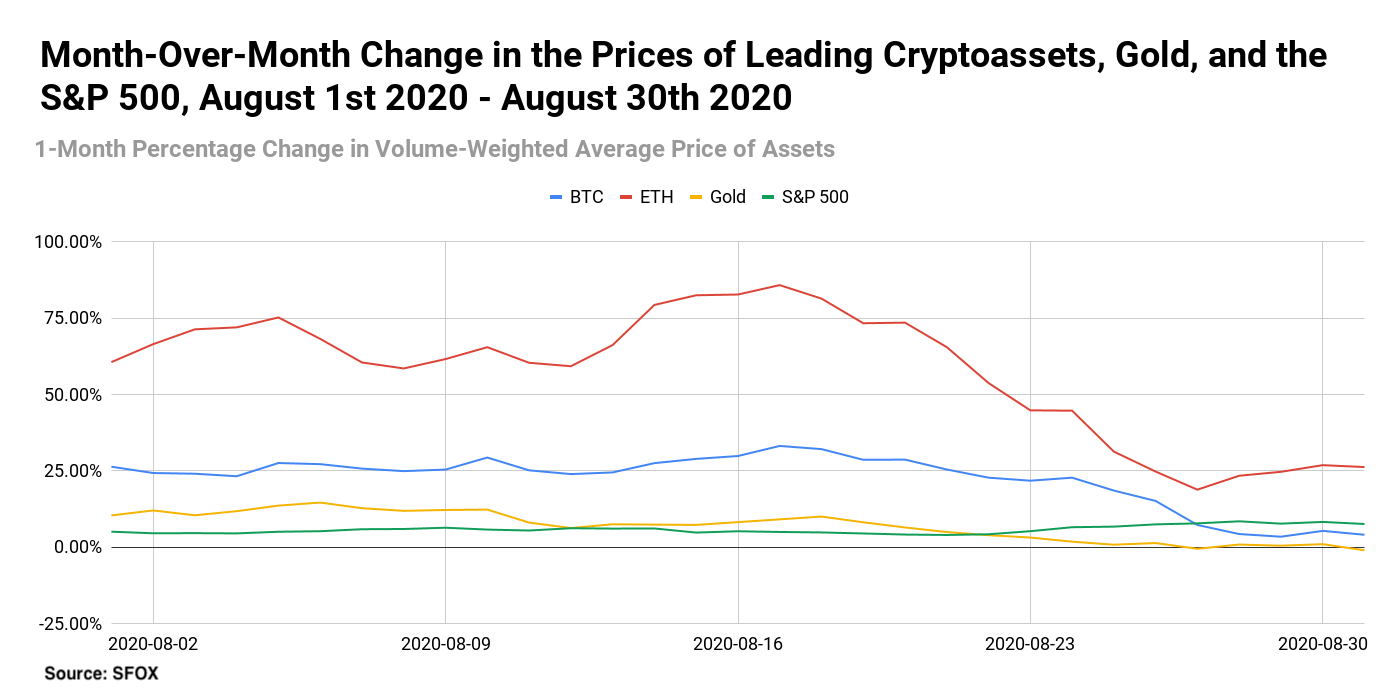
For greater graphical clarity, see this additional chart tracking only the daily returns of BTC, ETH, gold, and the S&P 500:
All the crypto assets available for trading on SFOX showed strong month-over-month gains in the beginning of the month and all peaked near the middle of the month with ETH leading the pack at 85.85% as of August 17th. This could be attributed to the expansion of the DeFi space as an Ethereum-based arena.
Aside from LINK’s expanding price, the coronavirus pandemic has given rise to several projects pushing DeFi as the U.S. dollar loses credibility. Fintech blockchain solution ShuttleOne, for example, used DeFi to take friction out of its supply chain, allowing markets and food outlets to keep up with increased demands. Furthermore, ConsolFreight engaged in a pilot project proving DeFi’s speed and cost effectiveness when compared with traditional finance.
All the assets except for BCH, BSV, and ETC closed the month with positive gains, while BSV had the largest month-over-month loss followed by ETC (13.67% and 8.69%, respectively) Unusually, gold and the S&P 500 showed higher month-over-month returns than all of these cryptocurrencies (233.83% and 109.77%, respectively). Gold has stretched deeper into “safe haven” territory as the dollar has exhibited increased instability.
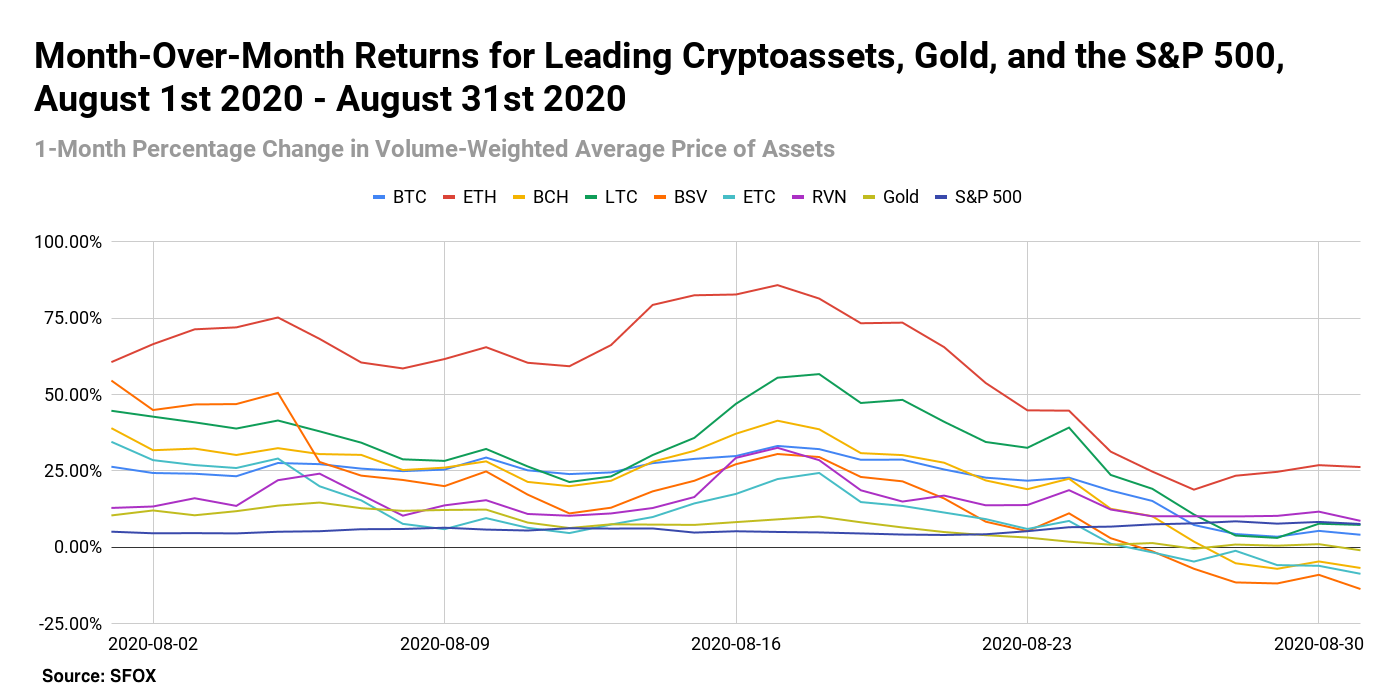
For greater graphical clarity, see this additional chart tracking only the month-over-month changes in the prices of BTC, ETH, gold, and the S&P 500:
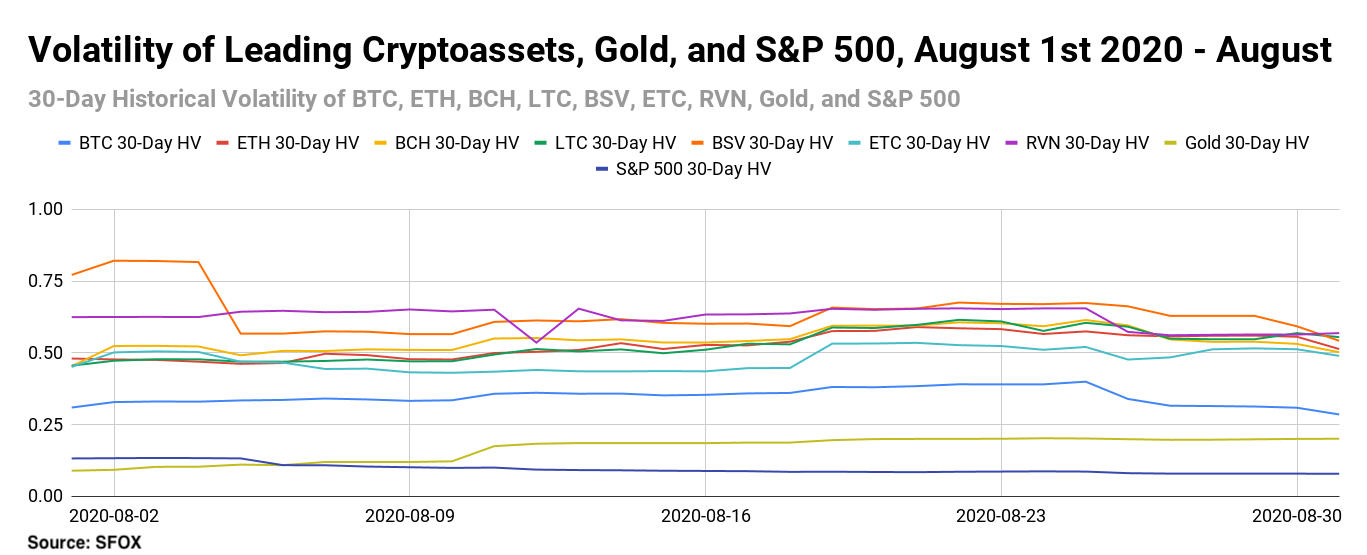
Volatility: Ramp-Up
Although crypto volatility had generally been consistent for the month of August, BSV’s 30-day historical volatility stood out with a 34% change by the end of the month. BSV kicked off August at 82.09%; by August 31st, it had fallen to 48.93%; meanwhile, Gold saw a significant increase starting the month at 8.92% and ending the month at 20.06%
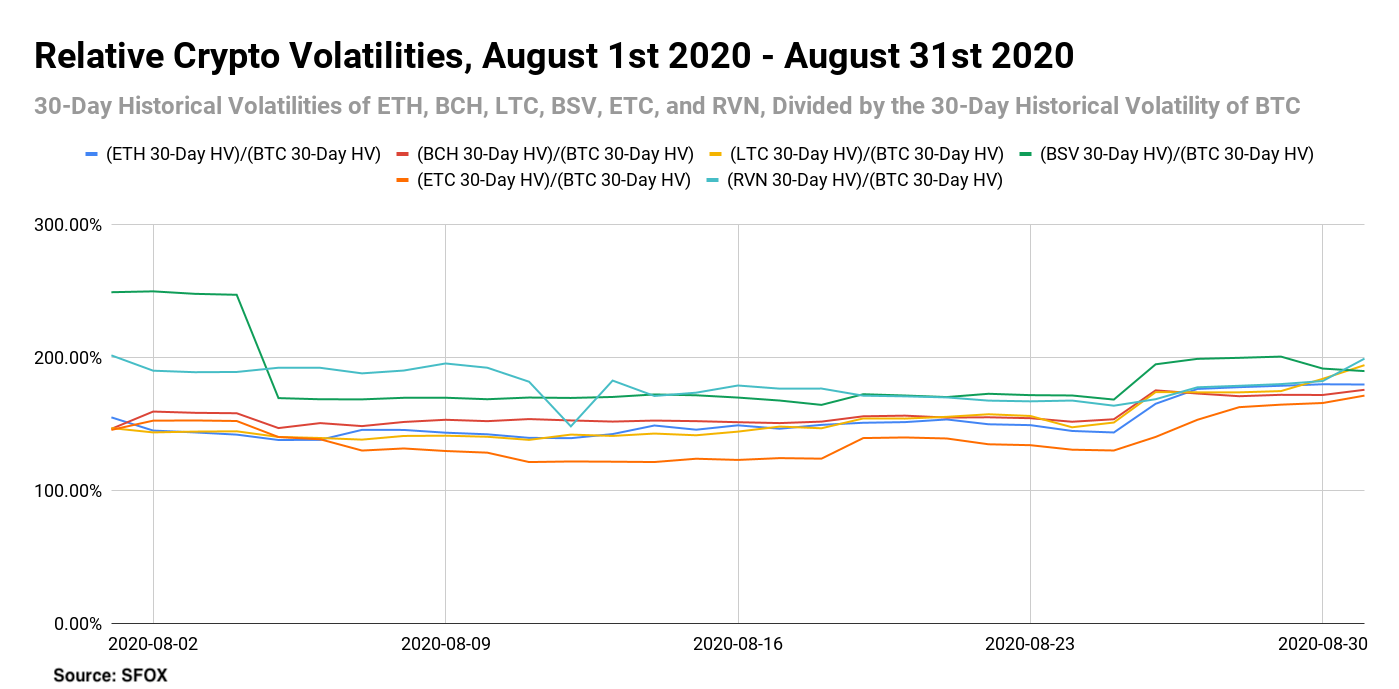
By looking at the 30-day historical volatilities of ETH, BCH, LTC, BSV, ETC, and RVN as a percentage of BTC’s 30-day historical volatility, we can see that altcoins’ volatilities remained fairly aligned with that of BTC over the course of the month—again, with the exception of BSV’s performance at the beginning of August.
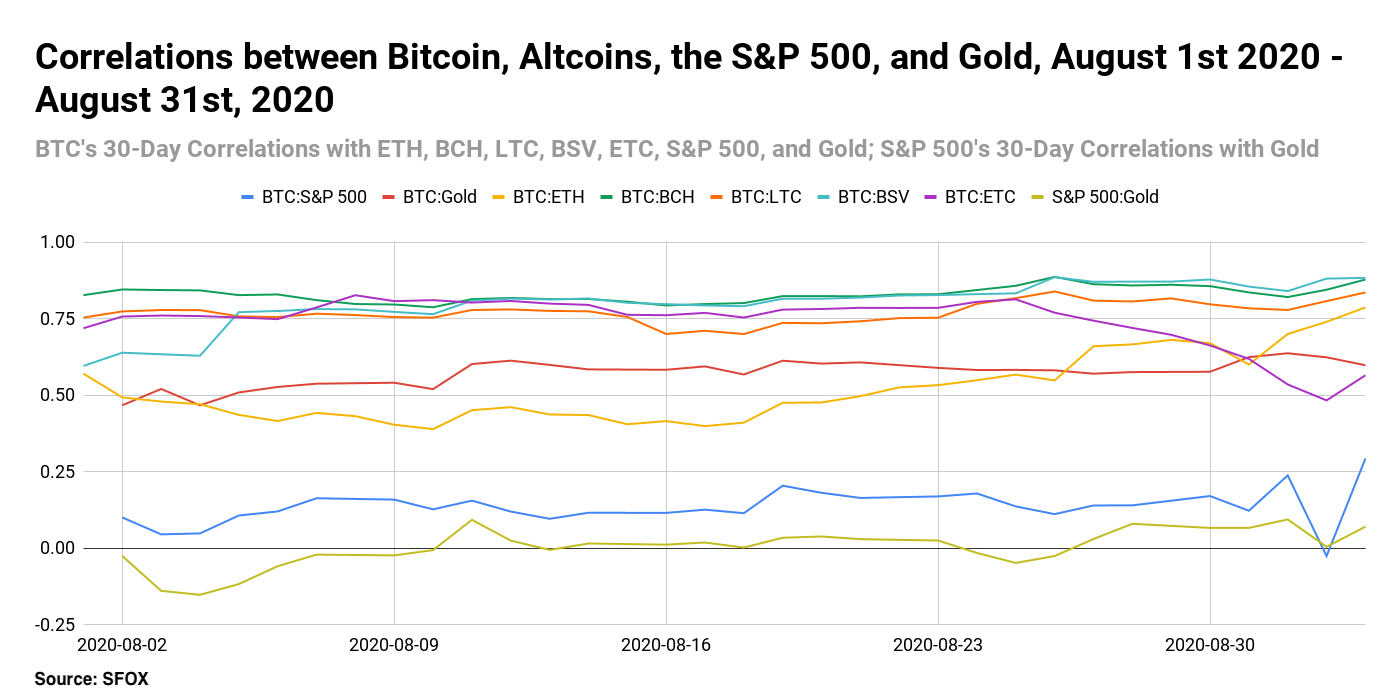
Price Correlations: The DeFi Apex?
The noteworthy story in this month’s correlation data is that ETH saw an atypically low correlation with other cryptocurrencies, including BTC. Some market participants may view this as validation that ETH-specific market factors like the rise of decentralized finance as an Ethereum-based sector and the coming move to staking in Ethereum 2.0 are making ETH an asset on its own terms rather than something that merely follows BTC, though Ethereum. 2.0 was temporarily scarred this month following a series of delays that accumulated in a single blackout that left its public testnet unavailable for a short period.
See the full SFOX crypto correlations matrix below:
For a more complete look at BTC’s correlations with other assets throughout the past month, see the following graph:
Appendix: Data Sources, Definitions, and Methodology
All cryptocurrency prices are denominated in USD unless otherwise noted.
Note that data collection for RVN began on February 2nd of this year, which is why RVN is not yet featured in all data analyses. RVN is also denominated in USD for ease of analysis and comparison with other crypto assets, though most RVN trading currently happens in the RVN/BTC pair.
We use two different in-house volatility indices in creating these reports:
1. 30-day historical volatility (HV) indices are calculated from daily snapshots over the relevant 30-day period using the formula:
30-Day HV Index = σ(Ln(P1/P0), Ln(P2/P1), …, Ln(P30/P29)) * √(365)
2. Daily historical volatility (HV) indices are calculated from 1440 snapshots over the relevant 24-hour period using the formula:
Daily HV Index = σ(Ln(P1/P0), Ln(P2/P1), …, Ln(P1440/P1439))* √(1440)
S&P 500 performance data are collected from Yahoo! Finance using GSPC (S&P 500 Index) data. Gold performance data are collected from Yahoo! Finance using GC=F (June 2020 gold futures contract) data.
30-day asset correlations are calculated using the Pearson method, in accordance with the following formula:
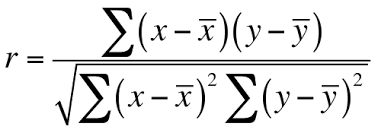
In our calculations, x = 30-day returns for BTC/USD, y = 30-day returns for the other asset in consideration, and r = the correlation coefficient between BTC and the other asset in consideration.
The crypto asset data sources aggregated for crypto prices, correlations, and volatility indices presented and analyzed in this report are the following eight exchanges, the order-book data of which we collect and store in real time:
- bitFlyer
- Binance
- Bitstamp
- Bittrex
- Coinbase
- Gemini
- itBit
- Kraken
Our indices’ integration of data from multiple top liquidity providers offers a more holistic view of the crypto market’s minute-to-minute movement. There are two problems with looking to any single liquidity provider for marketwide data:
- Different liquidity providers experience widely varying trade volumes. For example: according to CoinMarketCap, Binance saw over $20 billion USD in trading volume in November 2018, whereas Bitstamp saw $2 billion USD in trading volume in that same time — an order-of-magnitude difference. Therefore, treating any single liquidity provider’s data as representative of the overall market is myopic.
- Liquidity providers routinely experience interruptions in data collection. For instance, virtually every exchange undergoes regularly scheduled maintenance at one point or another, at which point their order books are unavailable and they therefore have no market data to collect or report. At best, this can prevent analysts from getting a full picture of market performance; at worst, it can make it virtually impossible to build metrics such as historical volatility indices.
Building volatility indices that collect real-time data from many distinct liquidity providers mitigates both of these problems: collecting and averaging data from different sources prevents any single source from having an outsized impact on our view of the market, and it also allows us to still have data for analysis even if one or two of those sources experience interruptions. We use five redundant data collection mechanisms for each exchange in order to ensure that our data collection will remain uninterrupted even in the event of multiple failures.