Summary:
- The SFOX Multi-Factor Market Index has been upgraded from neutral to mildly bullish as of August 3rd.
- OCC guidance, SEC votes and applications, and Russian laws paint a picture of more imminent institutional interest in crypto, particularly BTC and ETH.
- ETH’s correlation with BTC is especially low, suggesting the market may be viewing it more on its own terms rather than as something that merely tracks BTC.
- Generations seem split between gold and BTC as an alternative currency.
- BTC futures open interest is at its highest level in almost half a year.
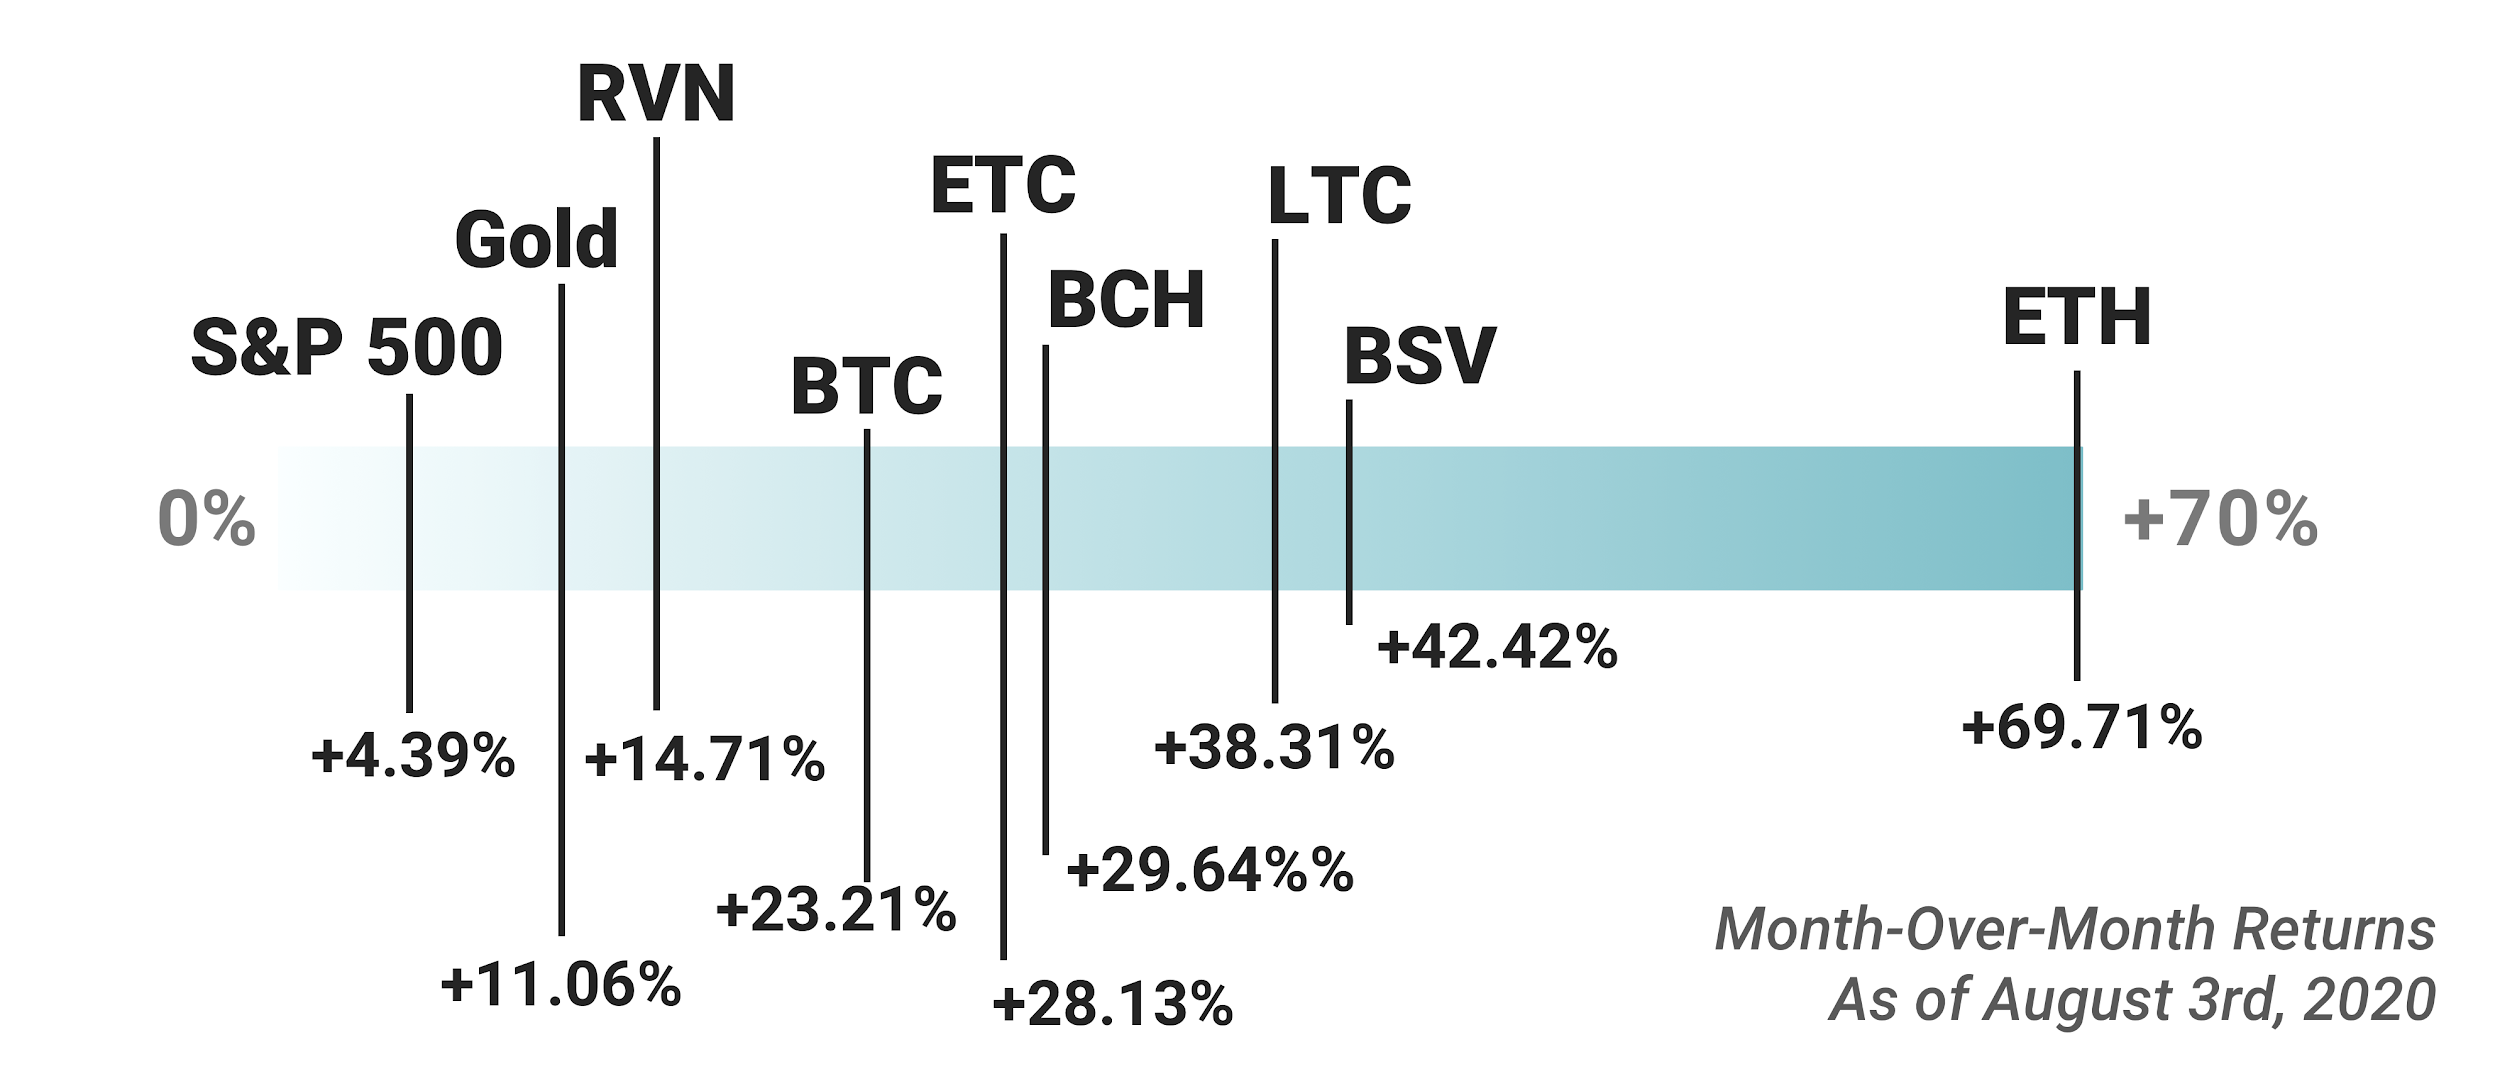
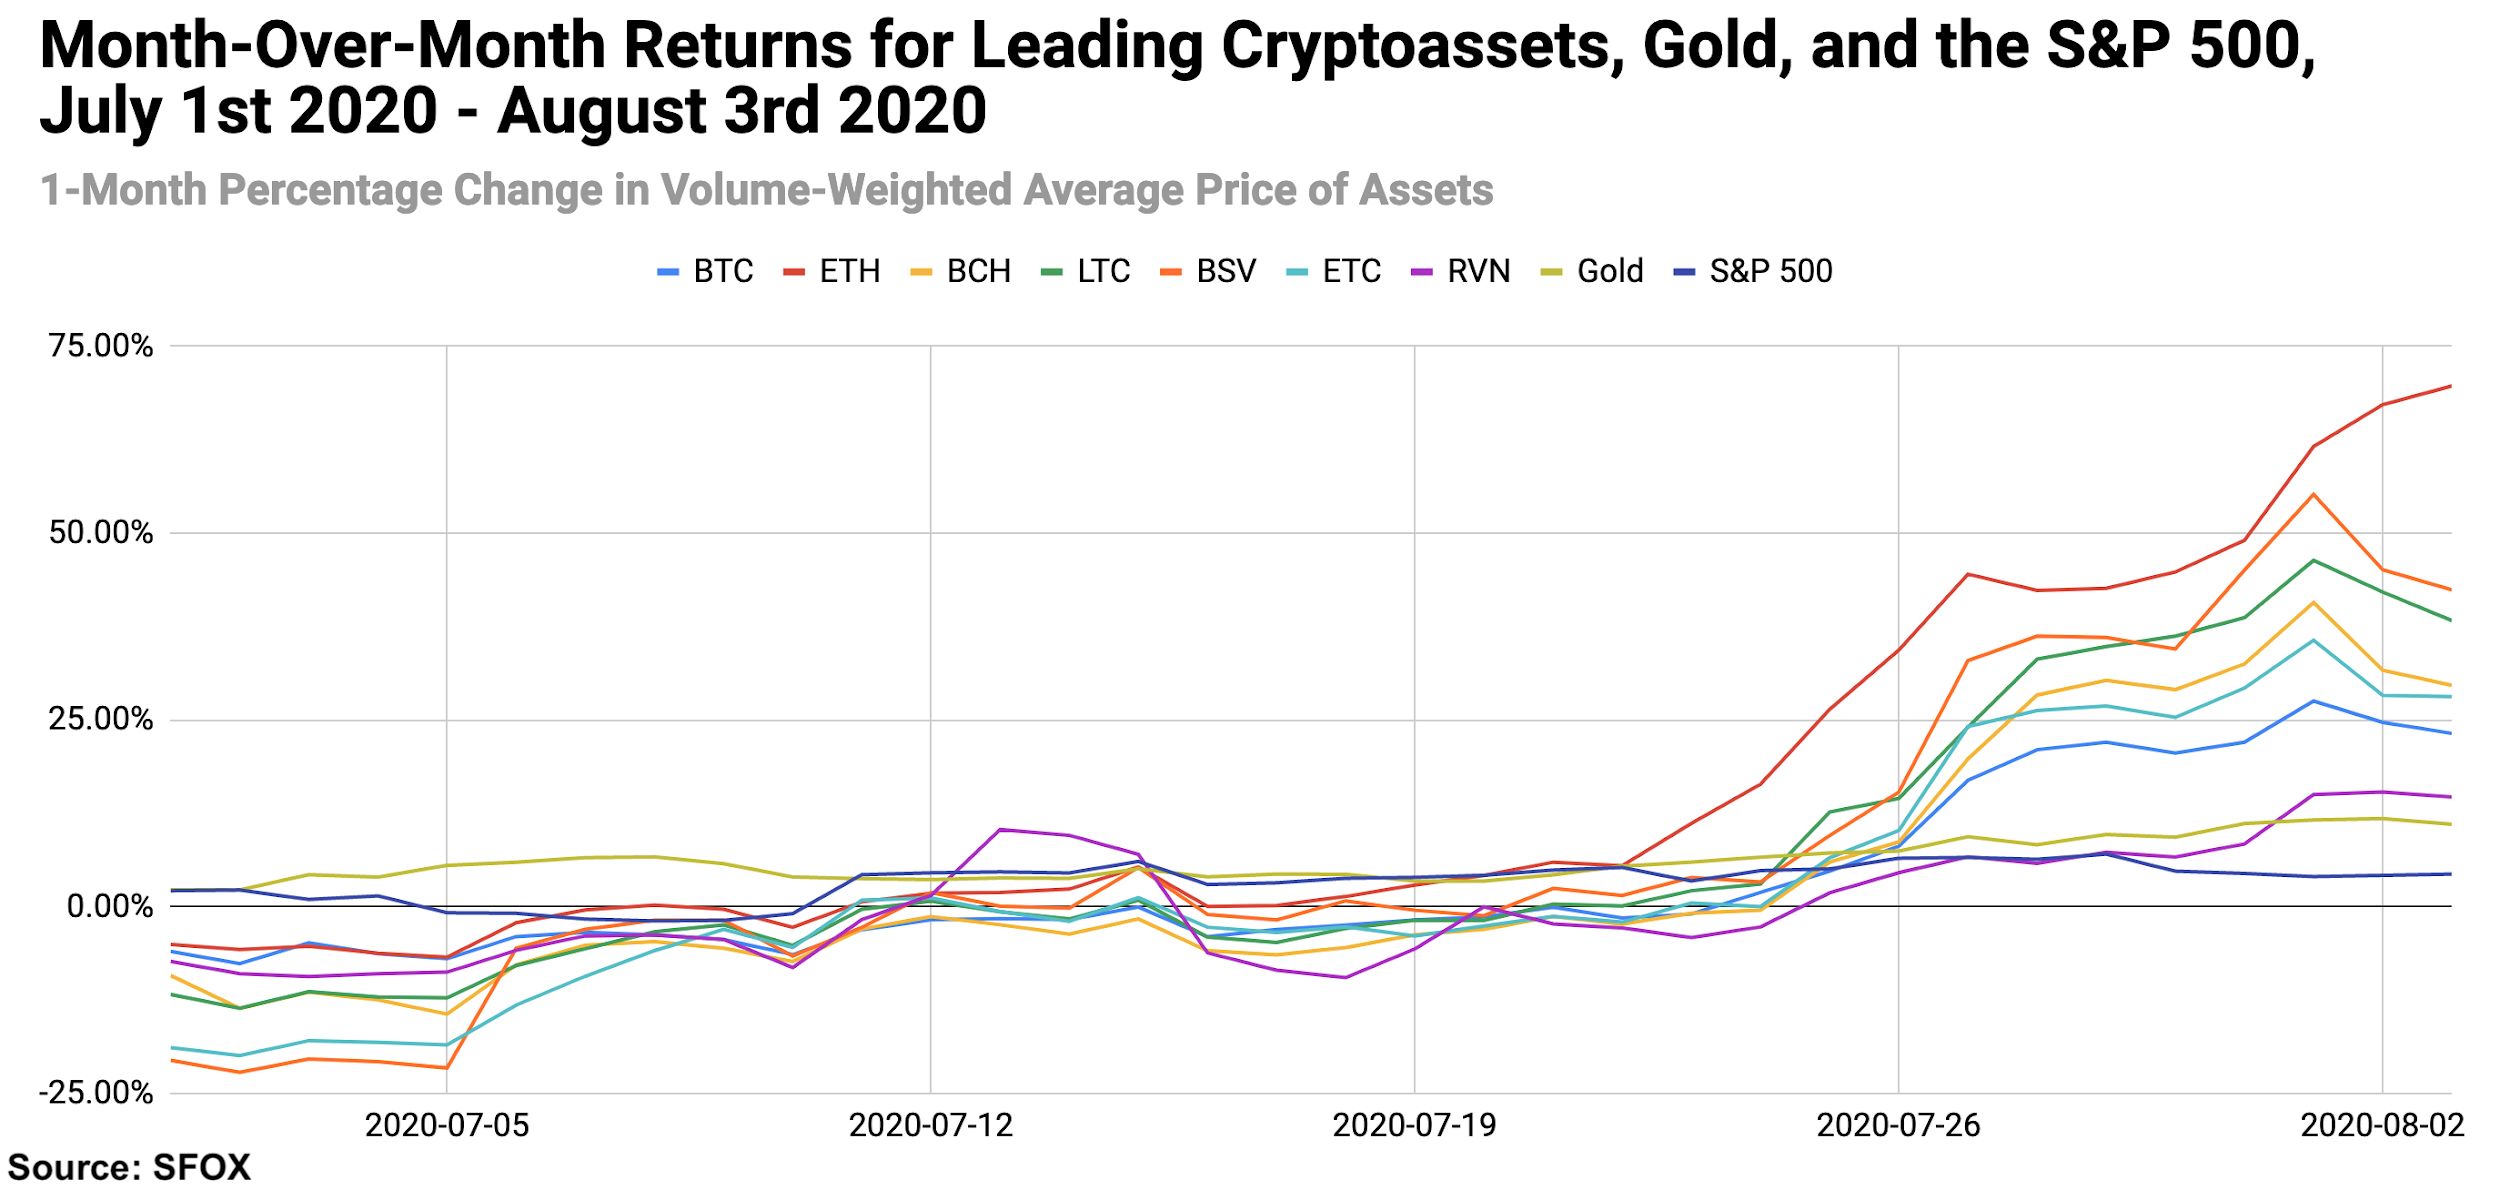
- ETH beat Gold, the S&P 500, and all other major cryptocurrencies in month-over-month returns as of August 3rd (69.71%).
In the August 2020 edition of the SFOX crypto market report, the SFOX Research Team reviews the crypto market’s volatility, correlations, and other performance metrics throughout the past month. We’ve aggregated price, volume, correlations, and volatility data from eight leading exchanges and liquidity providers to analyze the global performance of 7 major crypto assets — BTC, ETH, BCH, LTC, BSV, ETC, and RVN — all of which are available for smart-routing-powered trading on our trading platform.
The following is a report and analysis of their volatility, price correlations, and further development in the month of July and early August. (For more information on data sources and methodology, please consult the appendix at the end of the report.)
SFOX’s Current Crypto Market Outlook: Mildly Bullish
Based on our calculations and analyses, the SFOX Multi-Factor Market Index, which was set at neutral a month ago, has been upgraded to mildly bullish as of August 3rd, 2020.
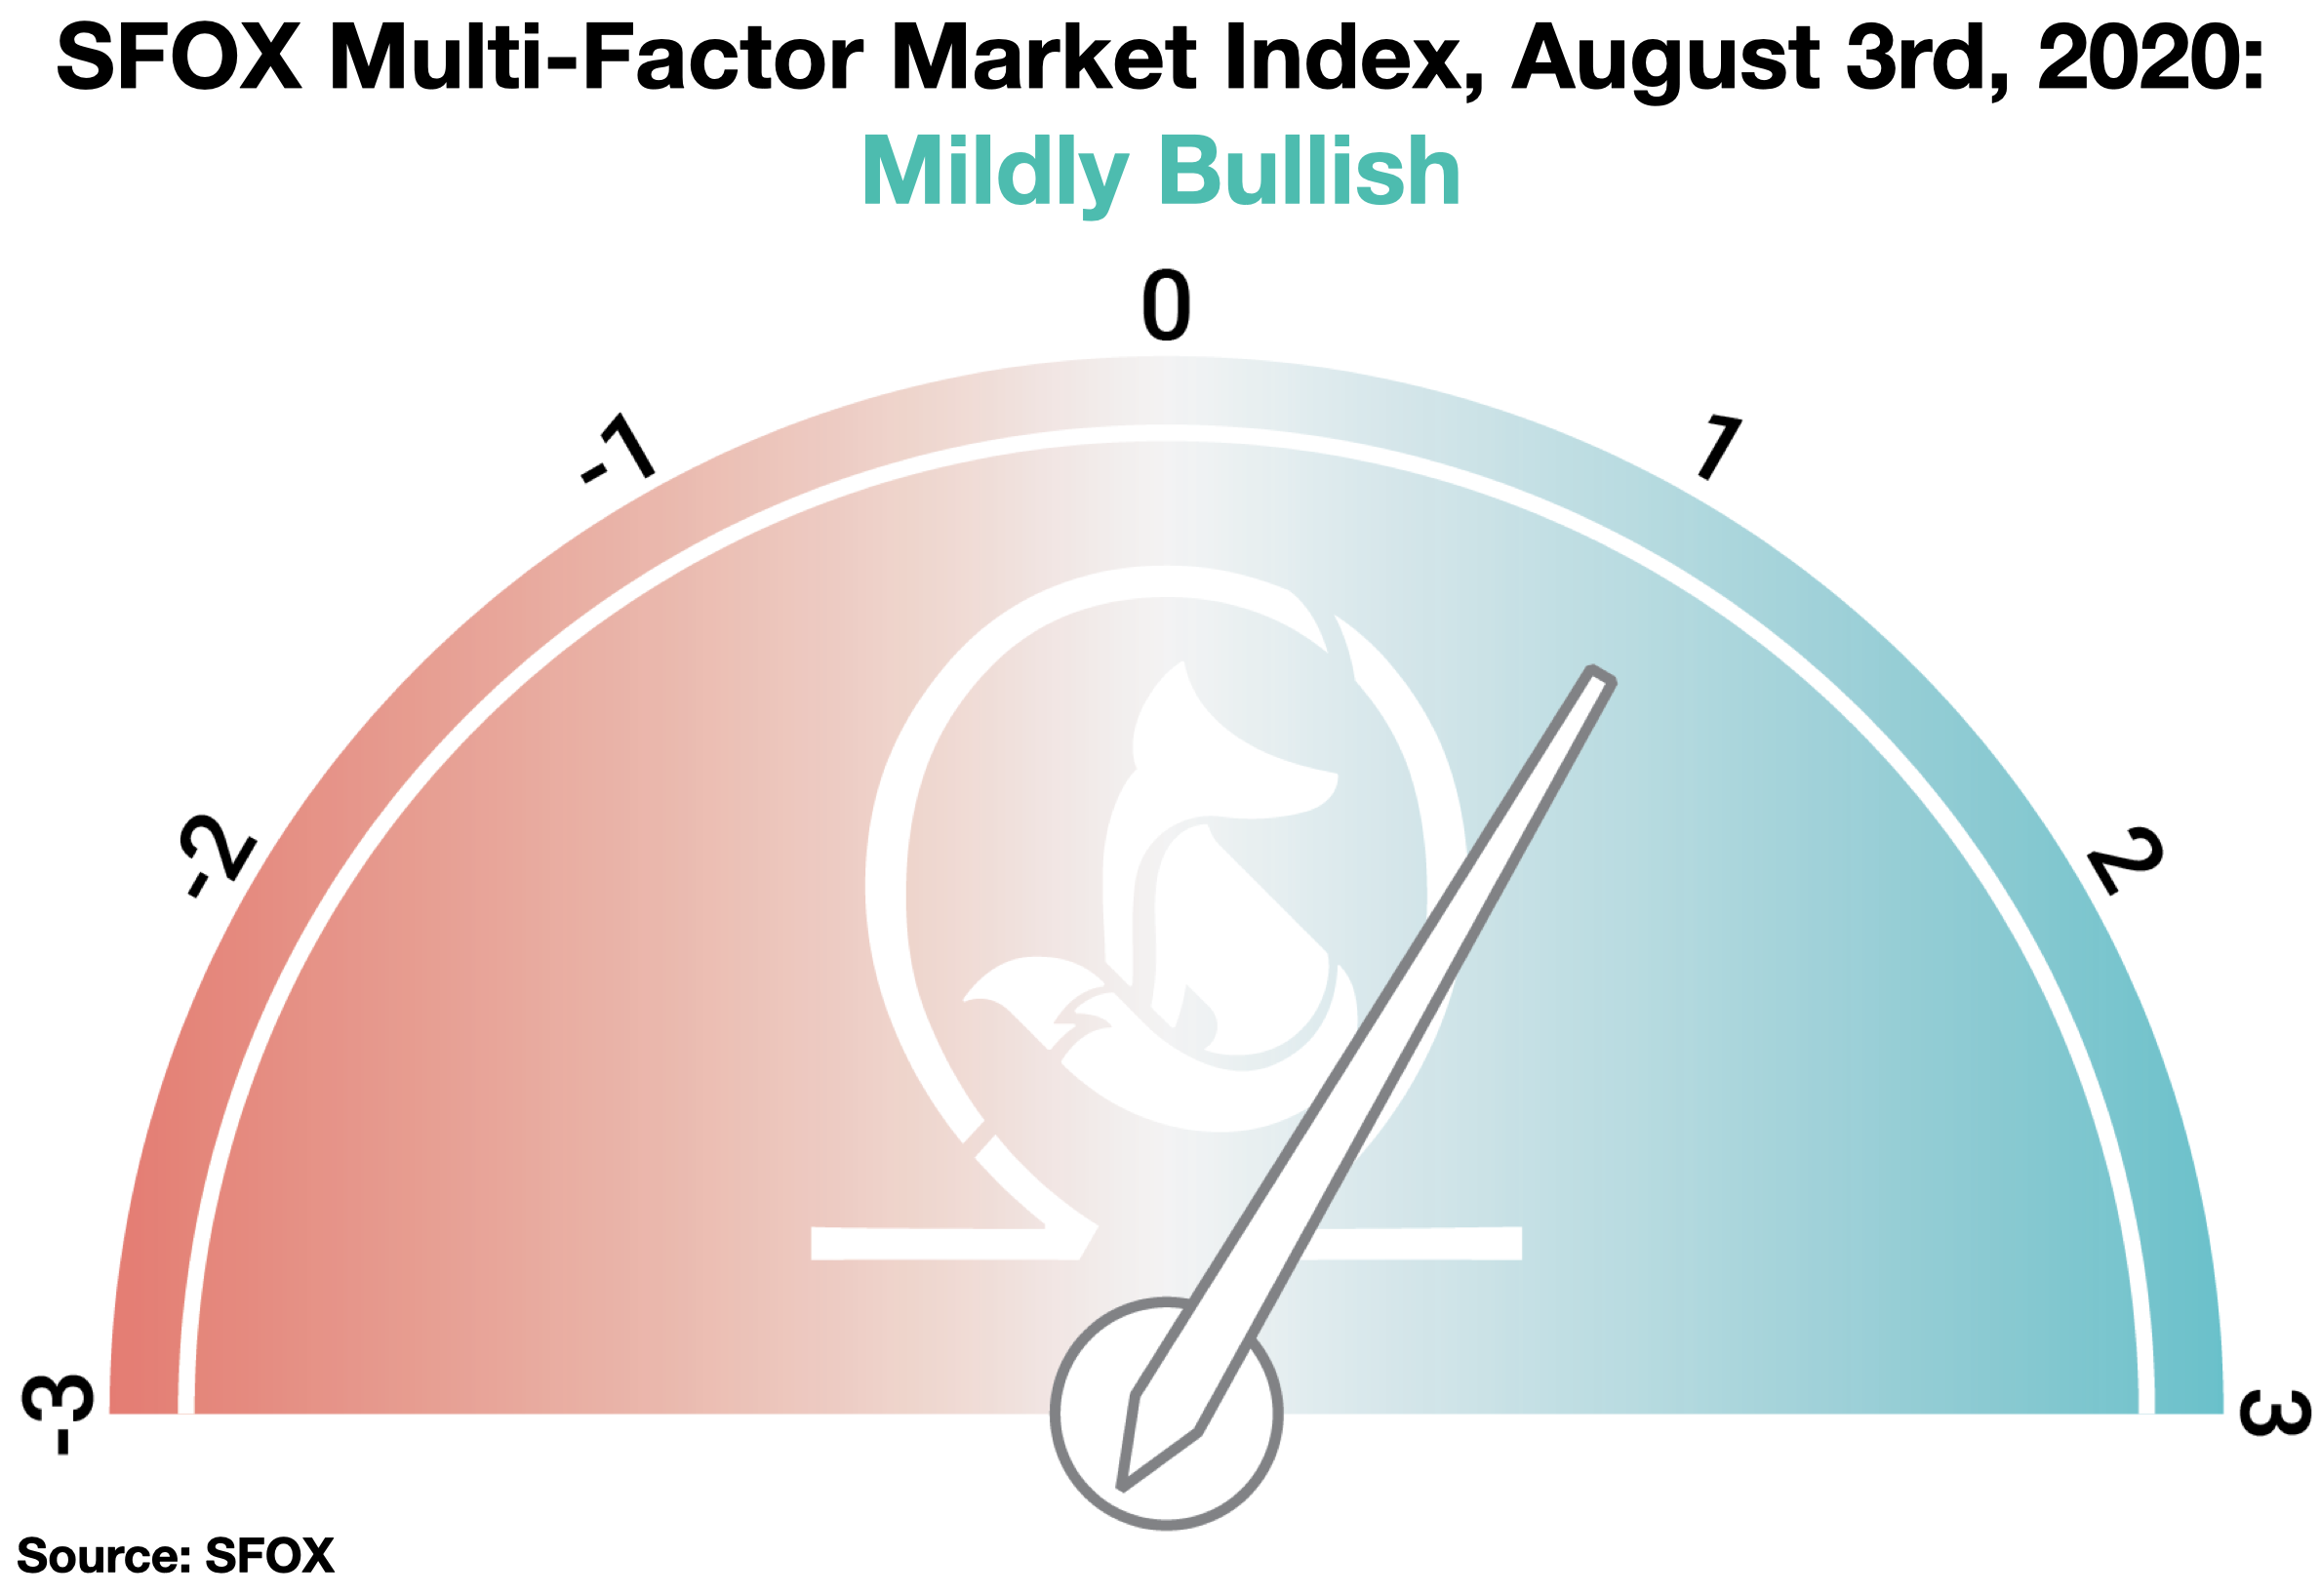
We determine the monthly value of this index by using proprietary, quantifiable indicators to analyze five market factors: price momentum, trade volume, market sentiment, volatility, and continued advancement of the sector. It is calculated using a proprietary formula that combines quantified, marketwide data on asset performance, search traffic, blockchain transactions, and more. The index ranges from highly bearish to highly bullish.
All the crypto assets available for trading on SFOX showed month-over-month gains as of August 3rd, along with the S&P 500 and gold. ETH stood out with the greatest gains (69.71%), consistent with its relative outperformance over the last three months. Perhaps surprisingly to some, BTC showed lower month-over month returns than ETH, BSV, LTC, BCH, and ETC (23.21%); RVN showed the lowest month-over-month returns in the report (14.71%).
In a month where the major media cycle was bitcoin’s sustained breakout above $10000, the full story of the crypto sector, while bullish, seems to still be largely anticipatory. A large number of regulatory movements and increased action in the BTC futures market seem to mark expectations about further moves to come rather than fervor about the current state of the market; in particular, it seems as though some market participants may be keeping an eye on the potential for further institutional investment in crypto, an old refrain of the sector, on a more immediate horizon. We may also be witnessing a reaction in crypto markets and other stores of value to the increasing amount of cash flooding global economies and potentially running the risk of devaluing the dollar.
Get the SFOX edge in volatile times through our smart-routing order types that capture the best available crypto prices from all major trading venues directly from your SFOX account.
What’s Happened in the Last Month and What to Watch Next
Markets
BTC and gold both saw upward breakouts, with research suggesting a generational split between the two assets (August 4th). Gold saw 11.06% month-over-month returns as of August 3rd, while Bitcoin saw 23.21% month-over-month returns. New research from JP Morgan suggests that one possible explanation for the relatively uncorrelated increases in these two assets is that young and old retail investors are both exploring “alternative currencies” in the midst of continued inflation and market turmoil, but young retail investors have favored BTC whereas old retail investors have favored gold. To the extent that these groups perceive these assets as stores of value in weak currency markets, this could potentially reflect both younger and older generations’ bearish outlook on the current economic climate.
BTC futures open interest has reached the highest level in over five months (August 6th). Aggregated bitcoin futures open interest stood at $5.33B this Thursday, according to data from skew. The rate of increase in open interest started to accelerate on July 20th, about one week ahead of BTC’s movement upwards from the mid-$9000s range.
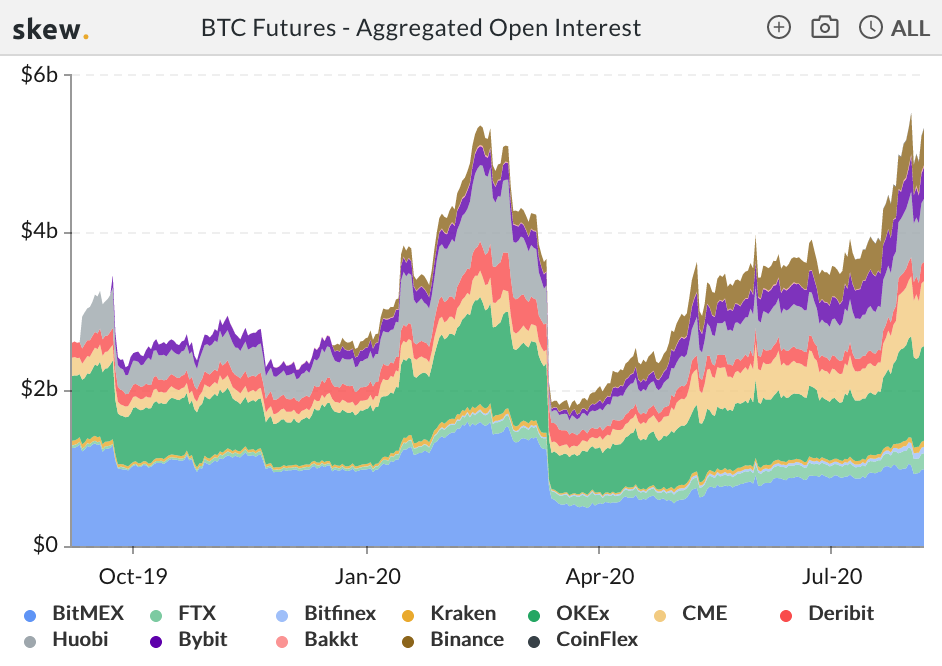
Traditionally, some market participants have viewed high levels of open interest as an indicator of the expectation, particularly among institutional investors, of significant future movements in the price of the underlying asset. Combined with news of further regulatory clarity and products geared at institutional investors, some might view this as a signal of larger, more sophisticated money entering the crypto markets.
Products
Grayscale Investments has filed for its Ethereum Trust to become an SEC-reporting company (August 6th). Amidst sustained interest in Ethereum as a decentralized finance vehicle and staking opportunity upon the rollout of Ethereum 2.0, Grayscale’s Ethereum Trust, which currently holds 1.9MM ETH (roughly $746MM), filed to become an SEC-reporting company. If approved, it would be the second cryptocurrency investment vehicle to become SEC-reporting, following in the footsteps of Grayscale’s Bitcoin Trust, an SEC-reporting entity currently holding roughly 400,000 BTC (roughly $4.745B). Taken in conjunction with other data such as the OCC’s recent guidance on banks’ ability to custody cryptocurrencies (see below) some market participants may view this as a sign of further institutional interest in getting exposure to cryptocurrencies.
Regulatory
The Office of the Comptroller of the Currency (OCC) issued historic guidance advising that national banks are within their rights to custody cryptocurrencies (July 22nd). The OCC published an interpretive letter concluding that “a national bank may provide these cryptocurrency custody services on behalf of customers, including by holding the unique cryptographic keys associated with cryptocurrency.” This preceded BTC’s price movement out of a narrow band in the mid-$9000s to a peak of $11444.64 five days later, leading some to interpret the price increase as at least partly responsive to the OCC’s guidance on more established financial institutions’ path to entering the crypto sector. This news corresponded with SFOX’s announcement of its new Atlas platform, a full-service custody, digital asset management, trade execution, and payment processing system for banks and other financial institutions.
The U.S. Senate voted in outspoken crypto advocate Hester Peirce for a second term as SEC Commissioner (August 6th). Peirce has become known by the nickname “Crypto Mom” for her progressive views on crypto regulation, including the idea of a “safe harbor” period for token-based crypto startups. In her July 21st testimony during her nomination hearing, Peirce underscored that cryptocurrencies are “going to be here to stay, and I would like us to set up a regulatory framework that works well for crypto.”
President Vladimir Putin signed a new law, effective January 2021, providing new regulatory clarity on the status of cryptocurrencies in Russia (July 31st). The law forbids cryptocurrencies from being used to pay for goods and services, while also identifying them as “digital rights comprising monetary claims” that can be traded and held. The law further clarifies that banks may open cryptocurrency exchanges on the condition that they register with Russia’s central bank.
Technical Developments
Ethereum Classic has experienced two apparent 51% attacks in the past week (July 29th – August 6th). Analytics firm Bitquery reported that Ethereum Classic sustained a 51% attack from July 29th through August 1st, during which time an attacker reportedly stole 807,000 ETC (~$6MM equivalent). On August 6th, Bitfly reported another 51% attack, which led to the reorganization of at least 4,000 Ethereum Classic blocks. From the 27th of July through the 6th of August, the price of ETC in BTC has fallen 16%, from 0.00071954 to 0.000608.
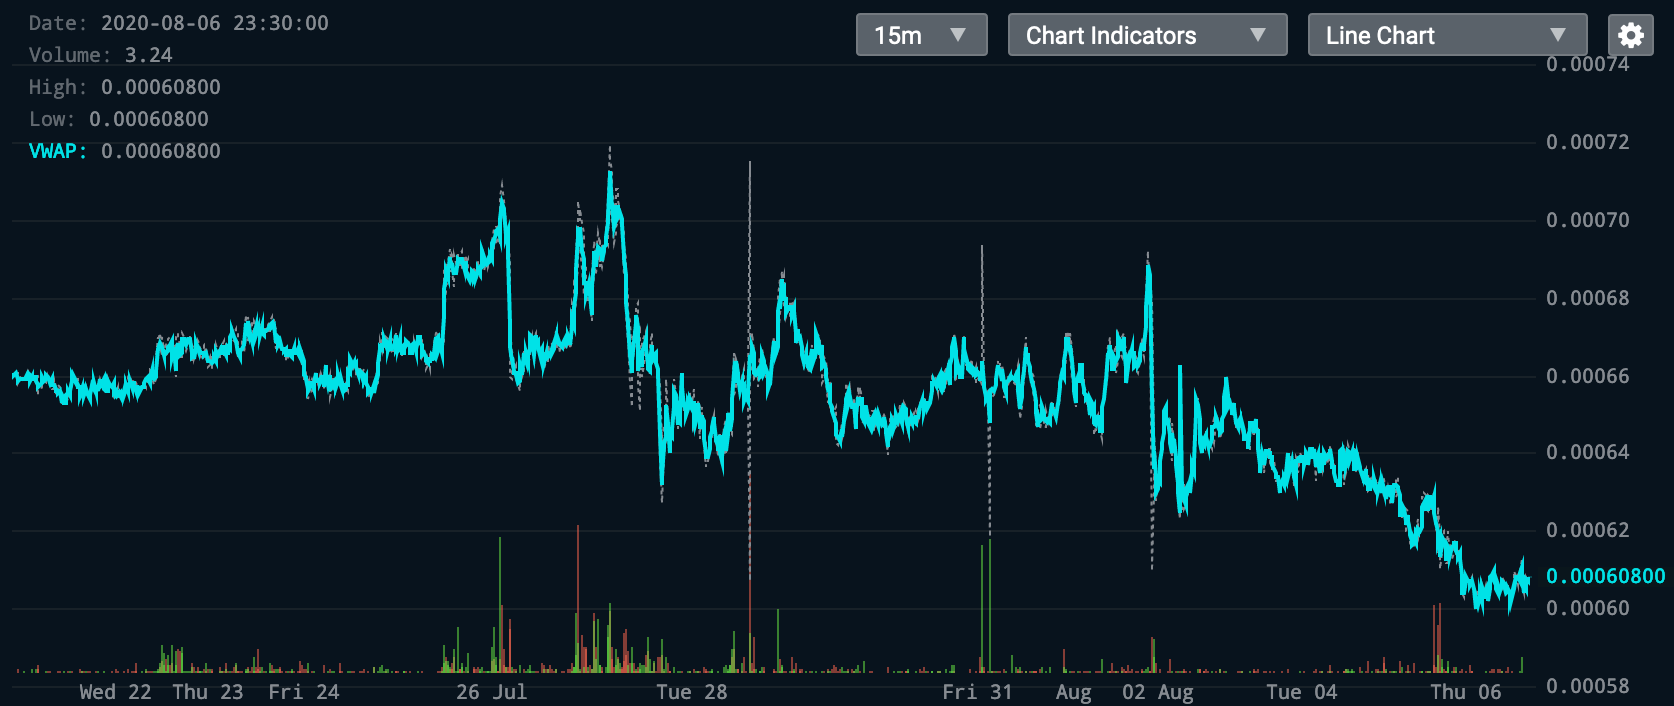
Ethereum Classics developers advised that ETC service providers “significantly raise confirmation times on all deposits and incoming transactions.” Meanwhile, Ethereum’s Vitalik Buterin took the opportunity to recommend that Ethereum Classic switch to a proof-of-stake confirmation mechanism. ETC is still available for trading on SFOX, but withdrawals and deposits of ETC are currently disabled as a safety precaution.
The Details: Crypto Price, Volatility, and Correlation Data, July 1st – August 3rd, 2020
Price Performance: Breakout
The volume-weighted average price of Bitcoin (BTC) started July at $9202.79; BTC’s VWAP broke through the $10000 level on July 27th and has been above that threshold ever since, clocking in at $11219.71 on August 3rd. 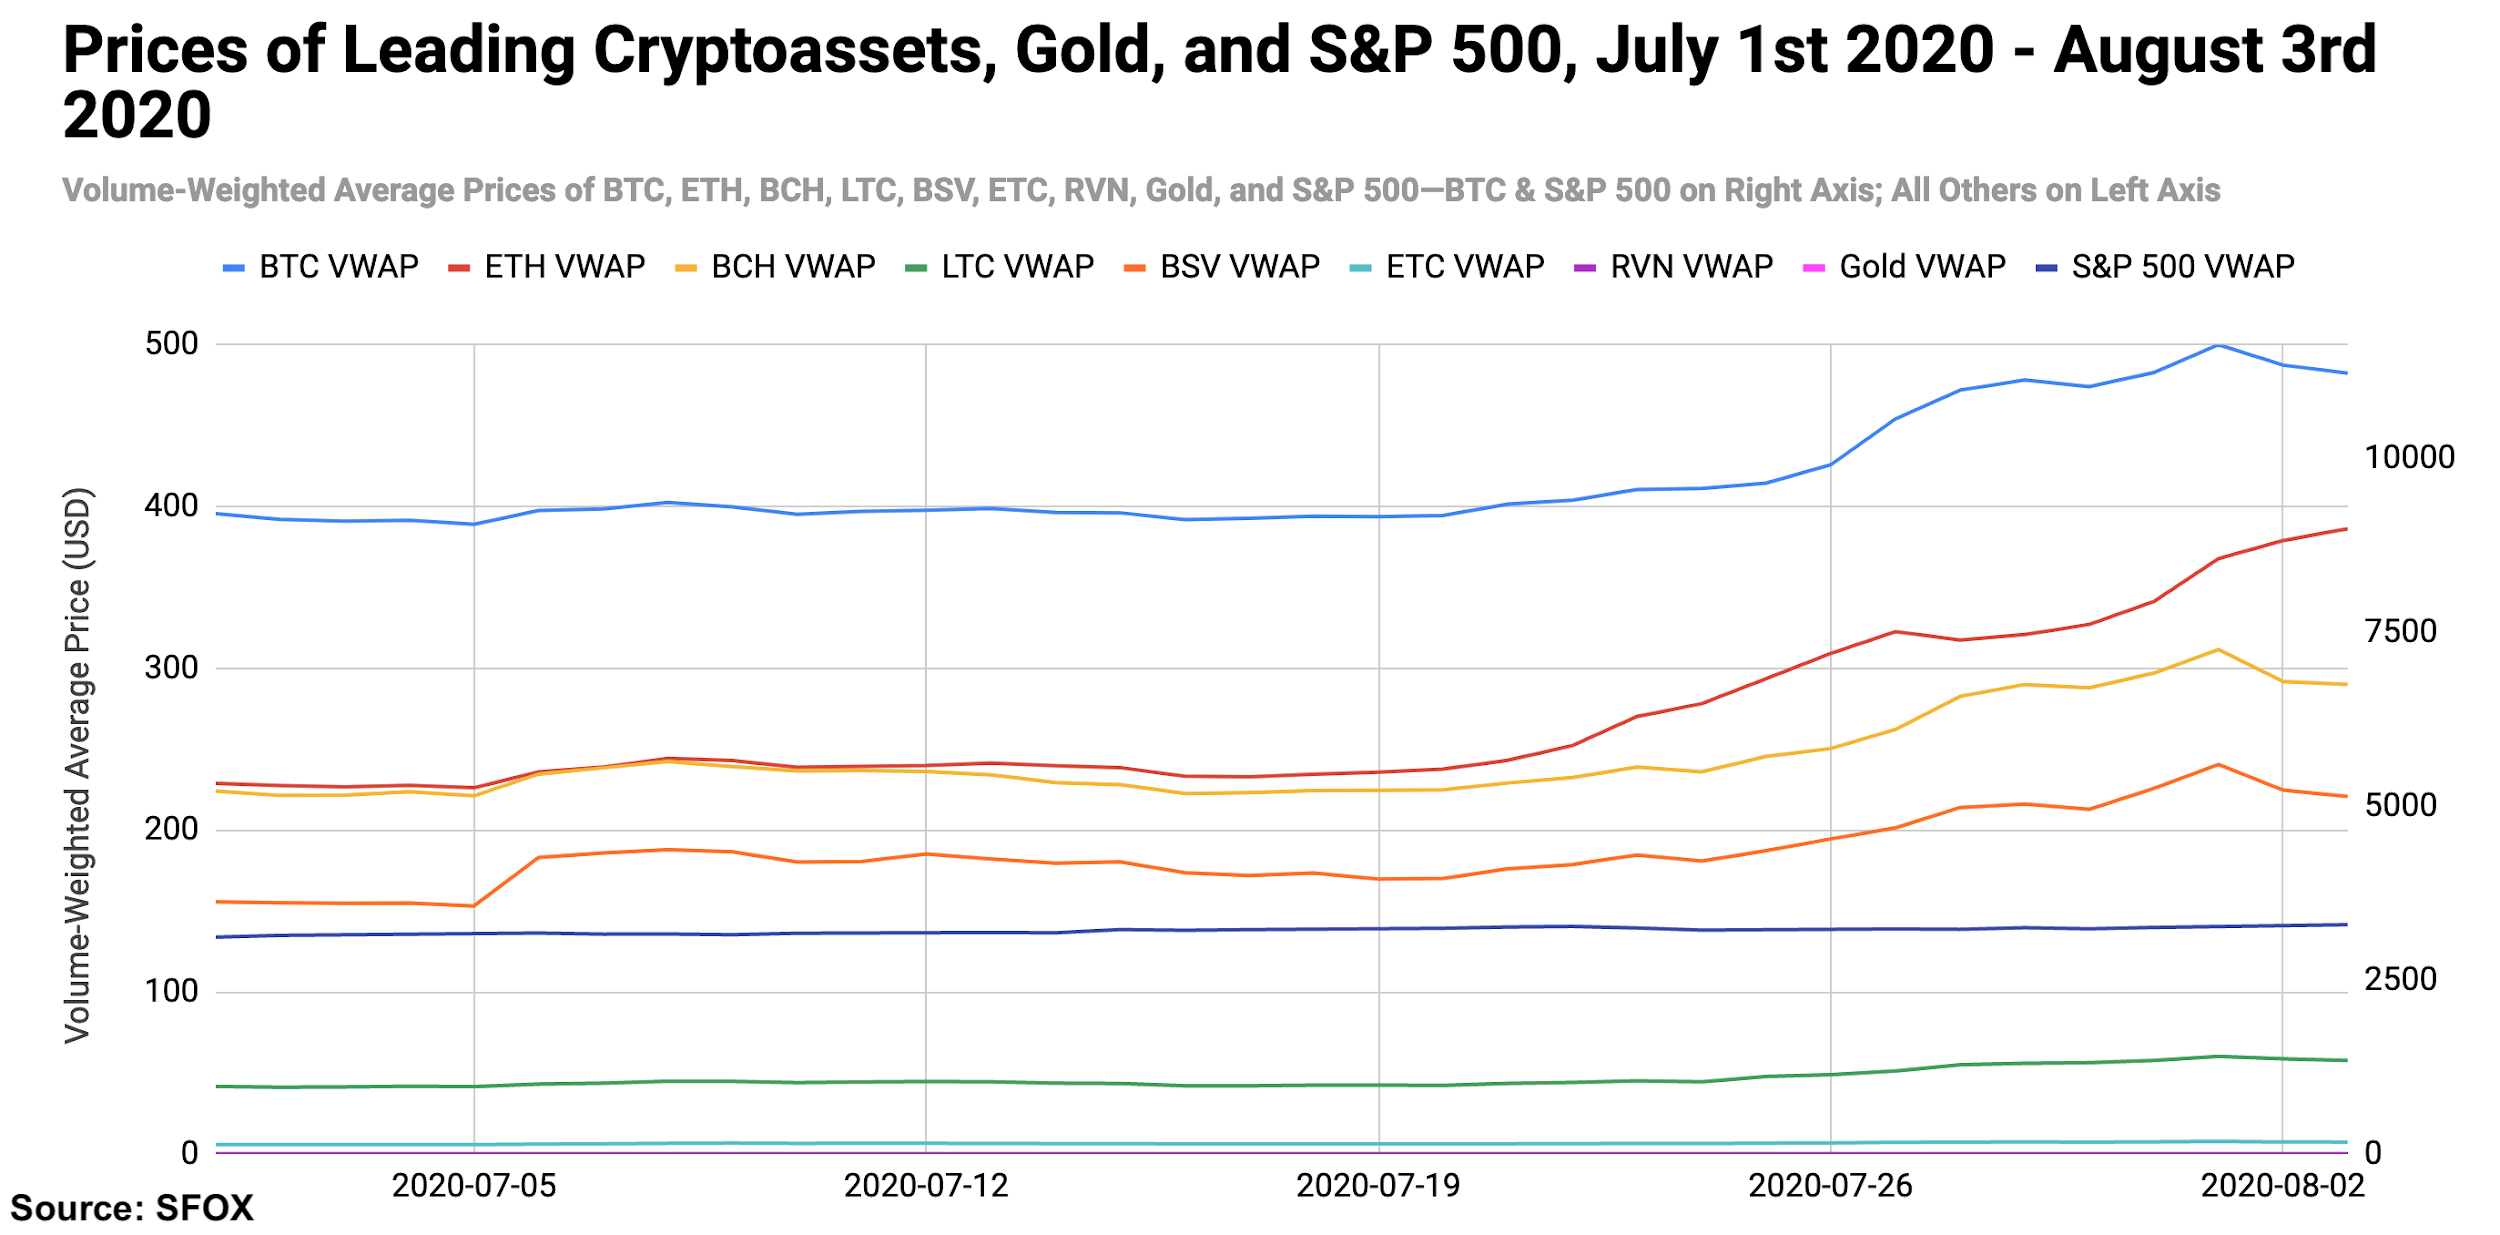
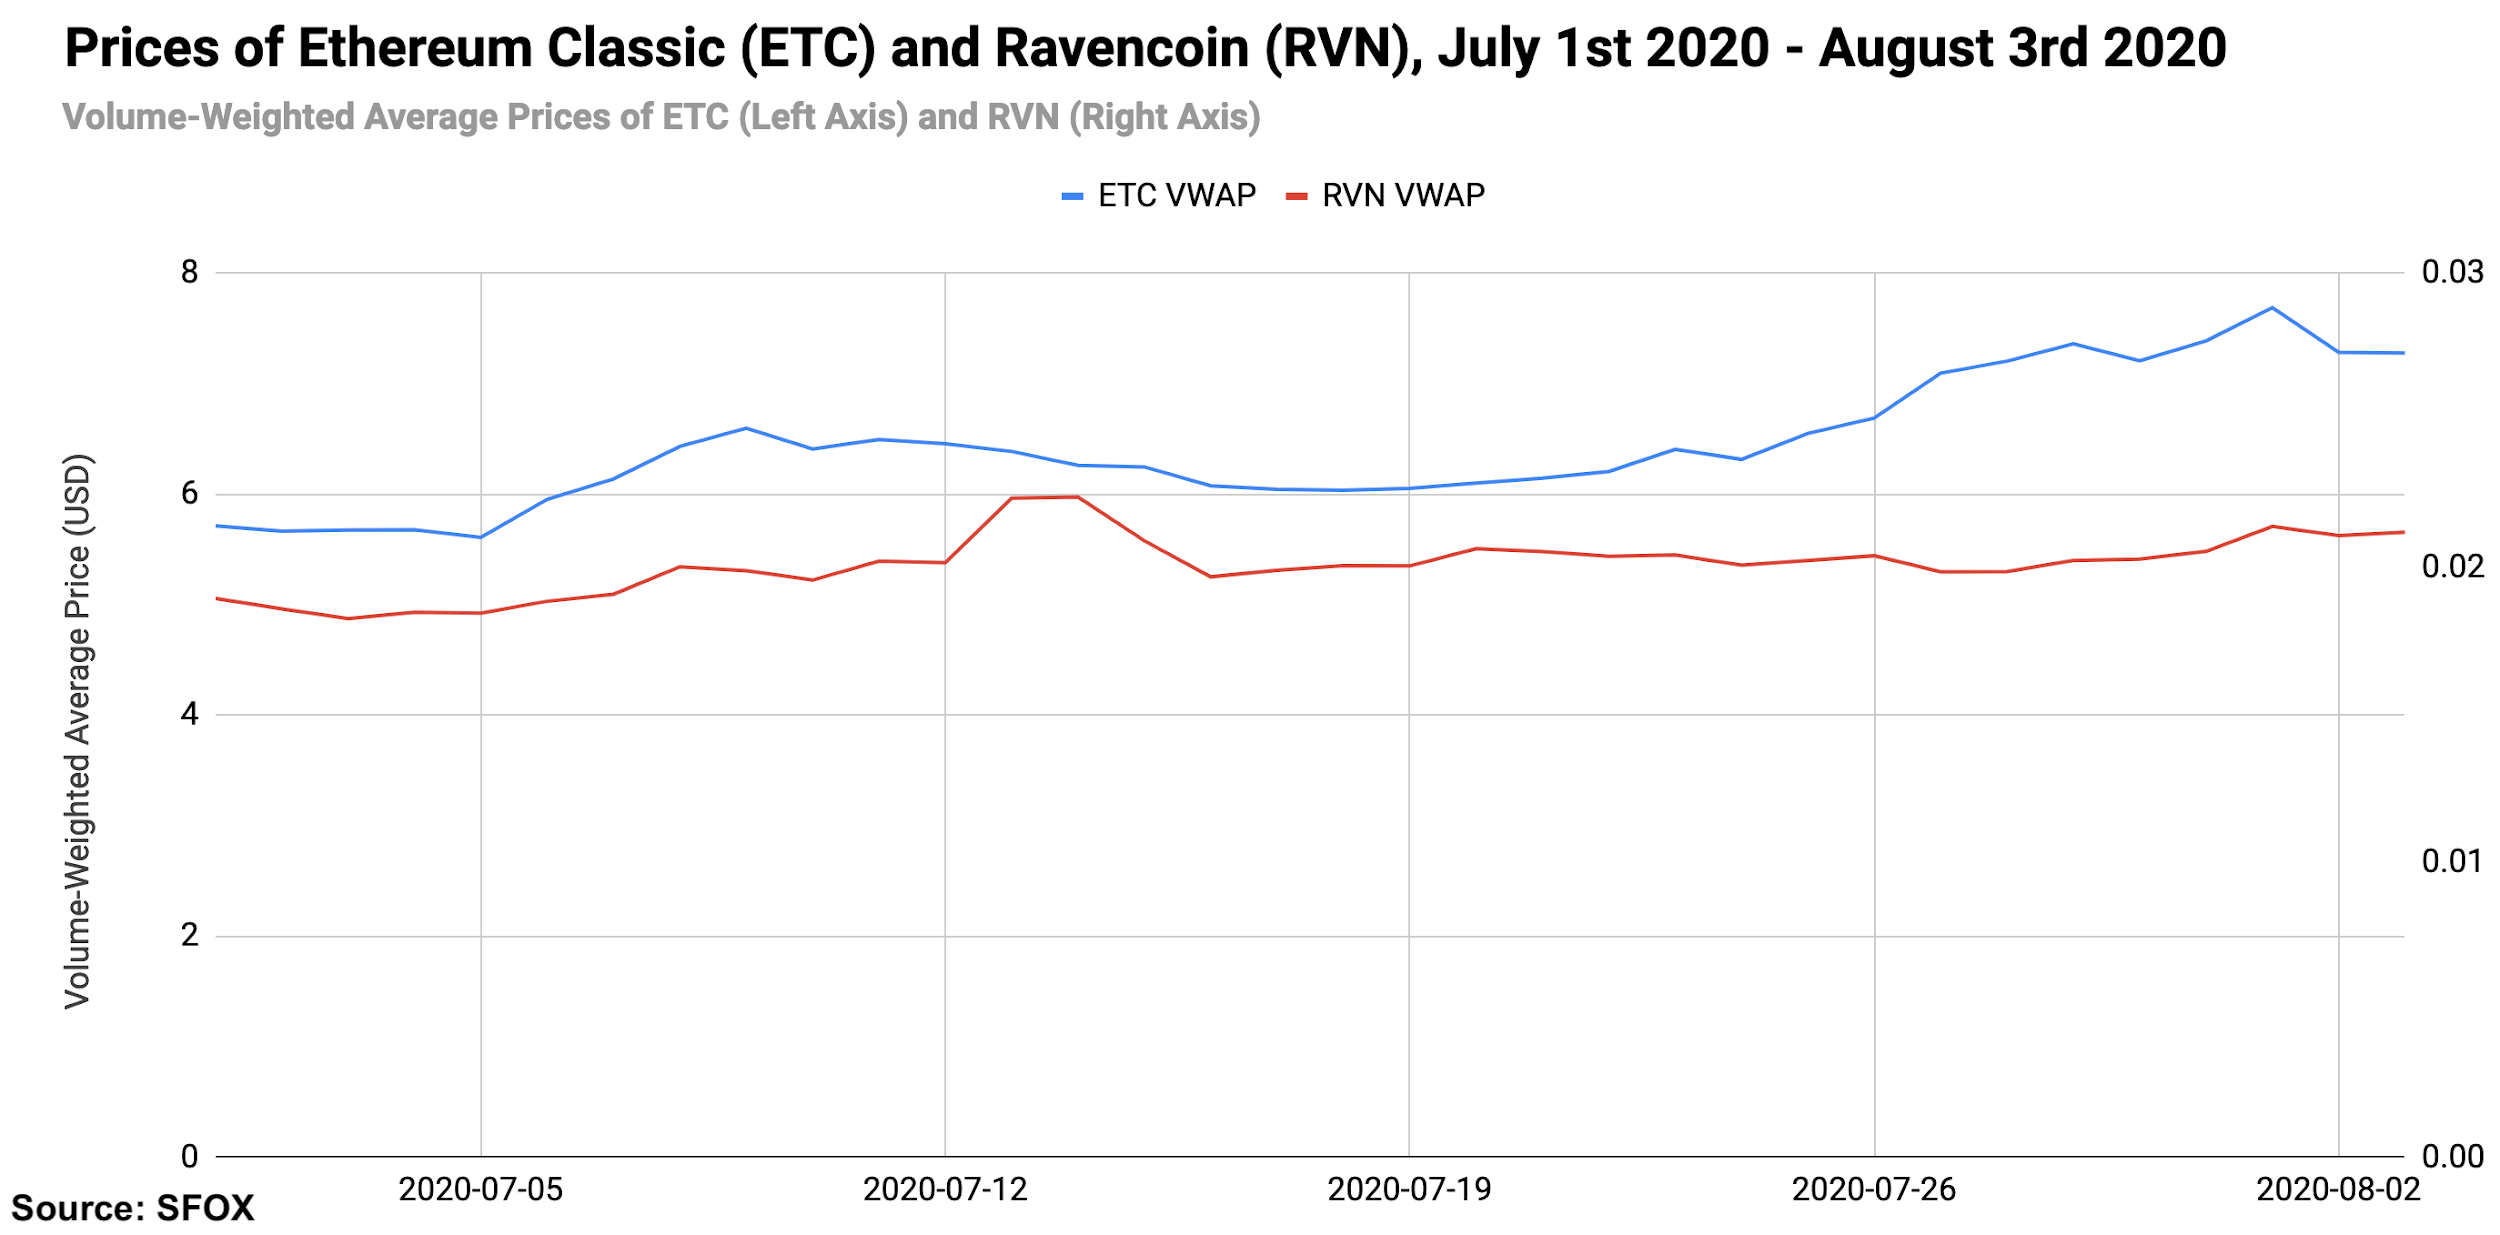
For better visibility of ETC and RVN price movements, please consult the following graph:
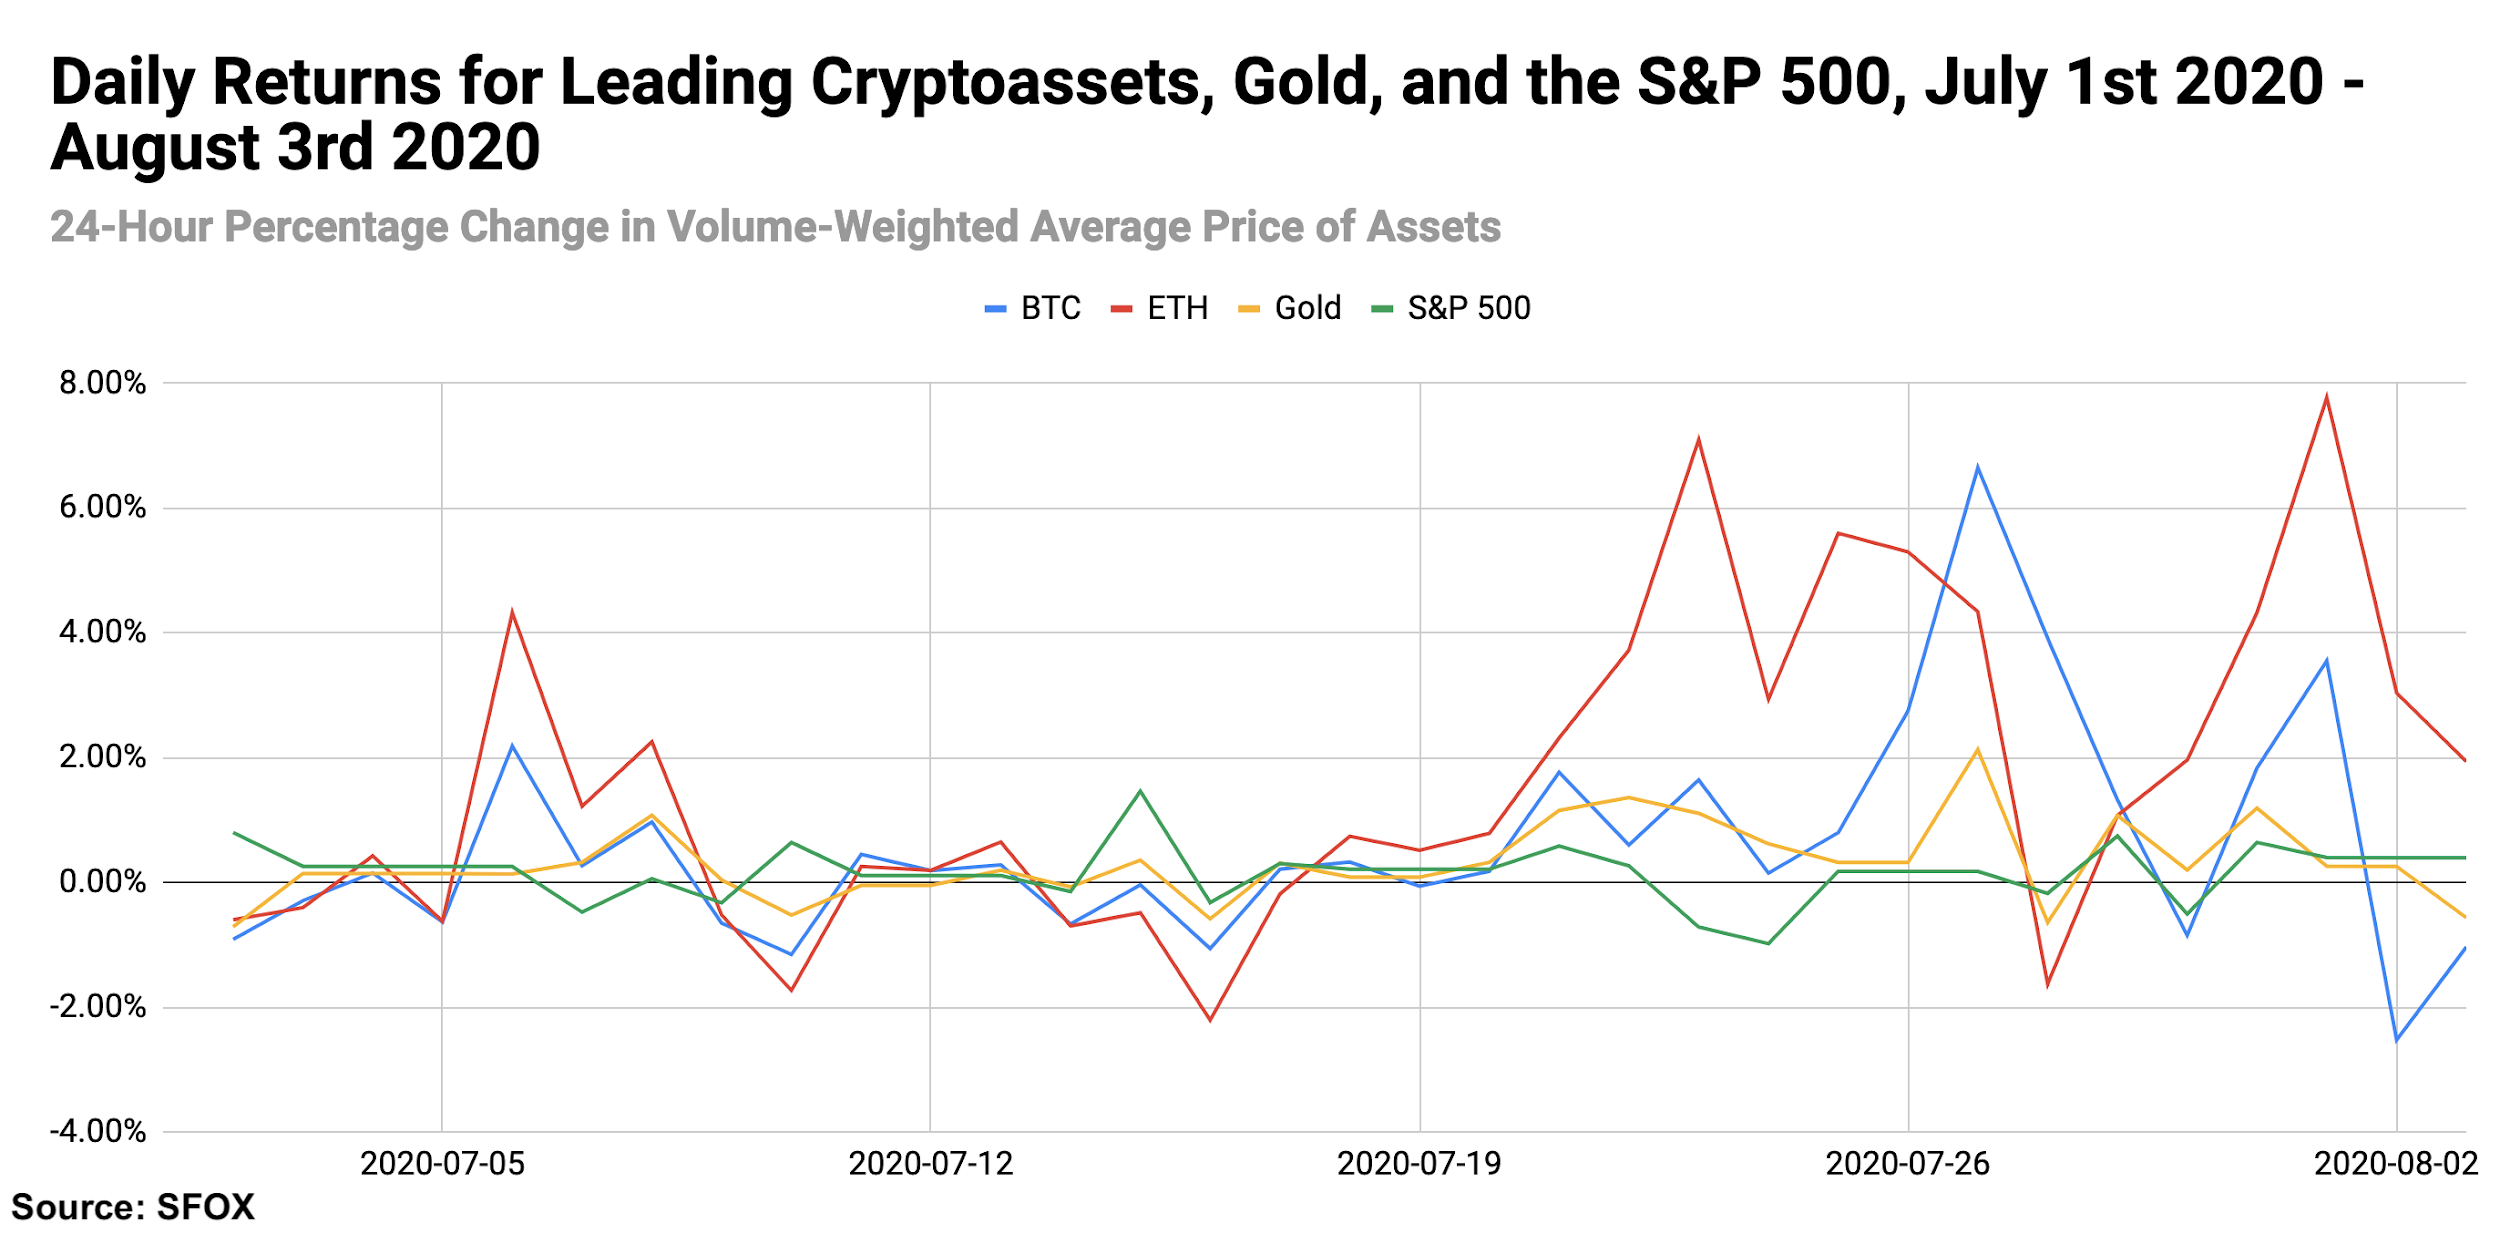
While all assets tracked by SFOX’s report saw significant daily gains near the end of the past month, BSV and RVN stood out as outliers for the double-digit single-day gains: BSV gained 19.58% on July 6th, and RVN gained 10.86% on July 13th.
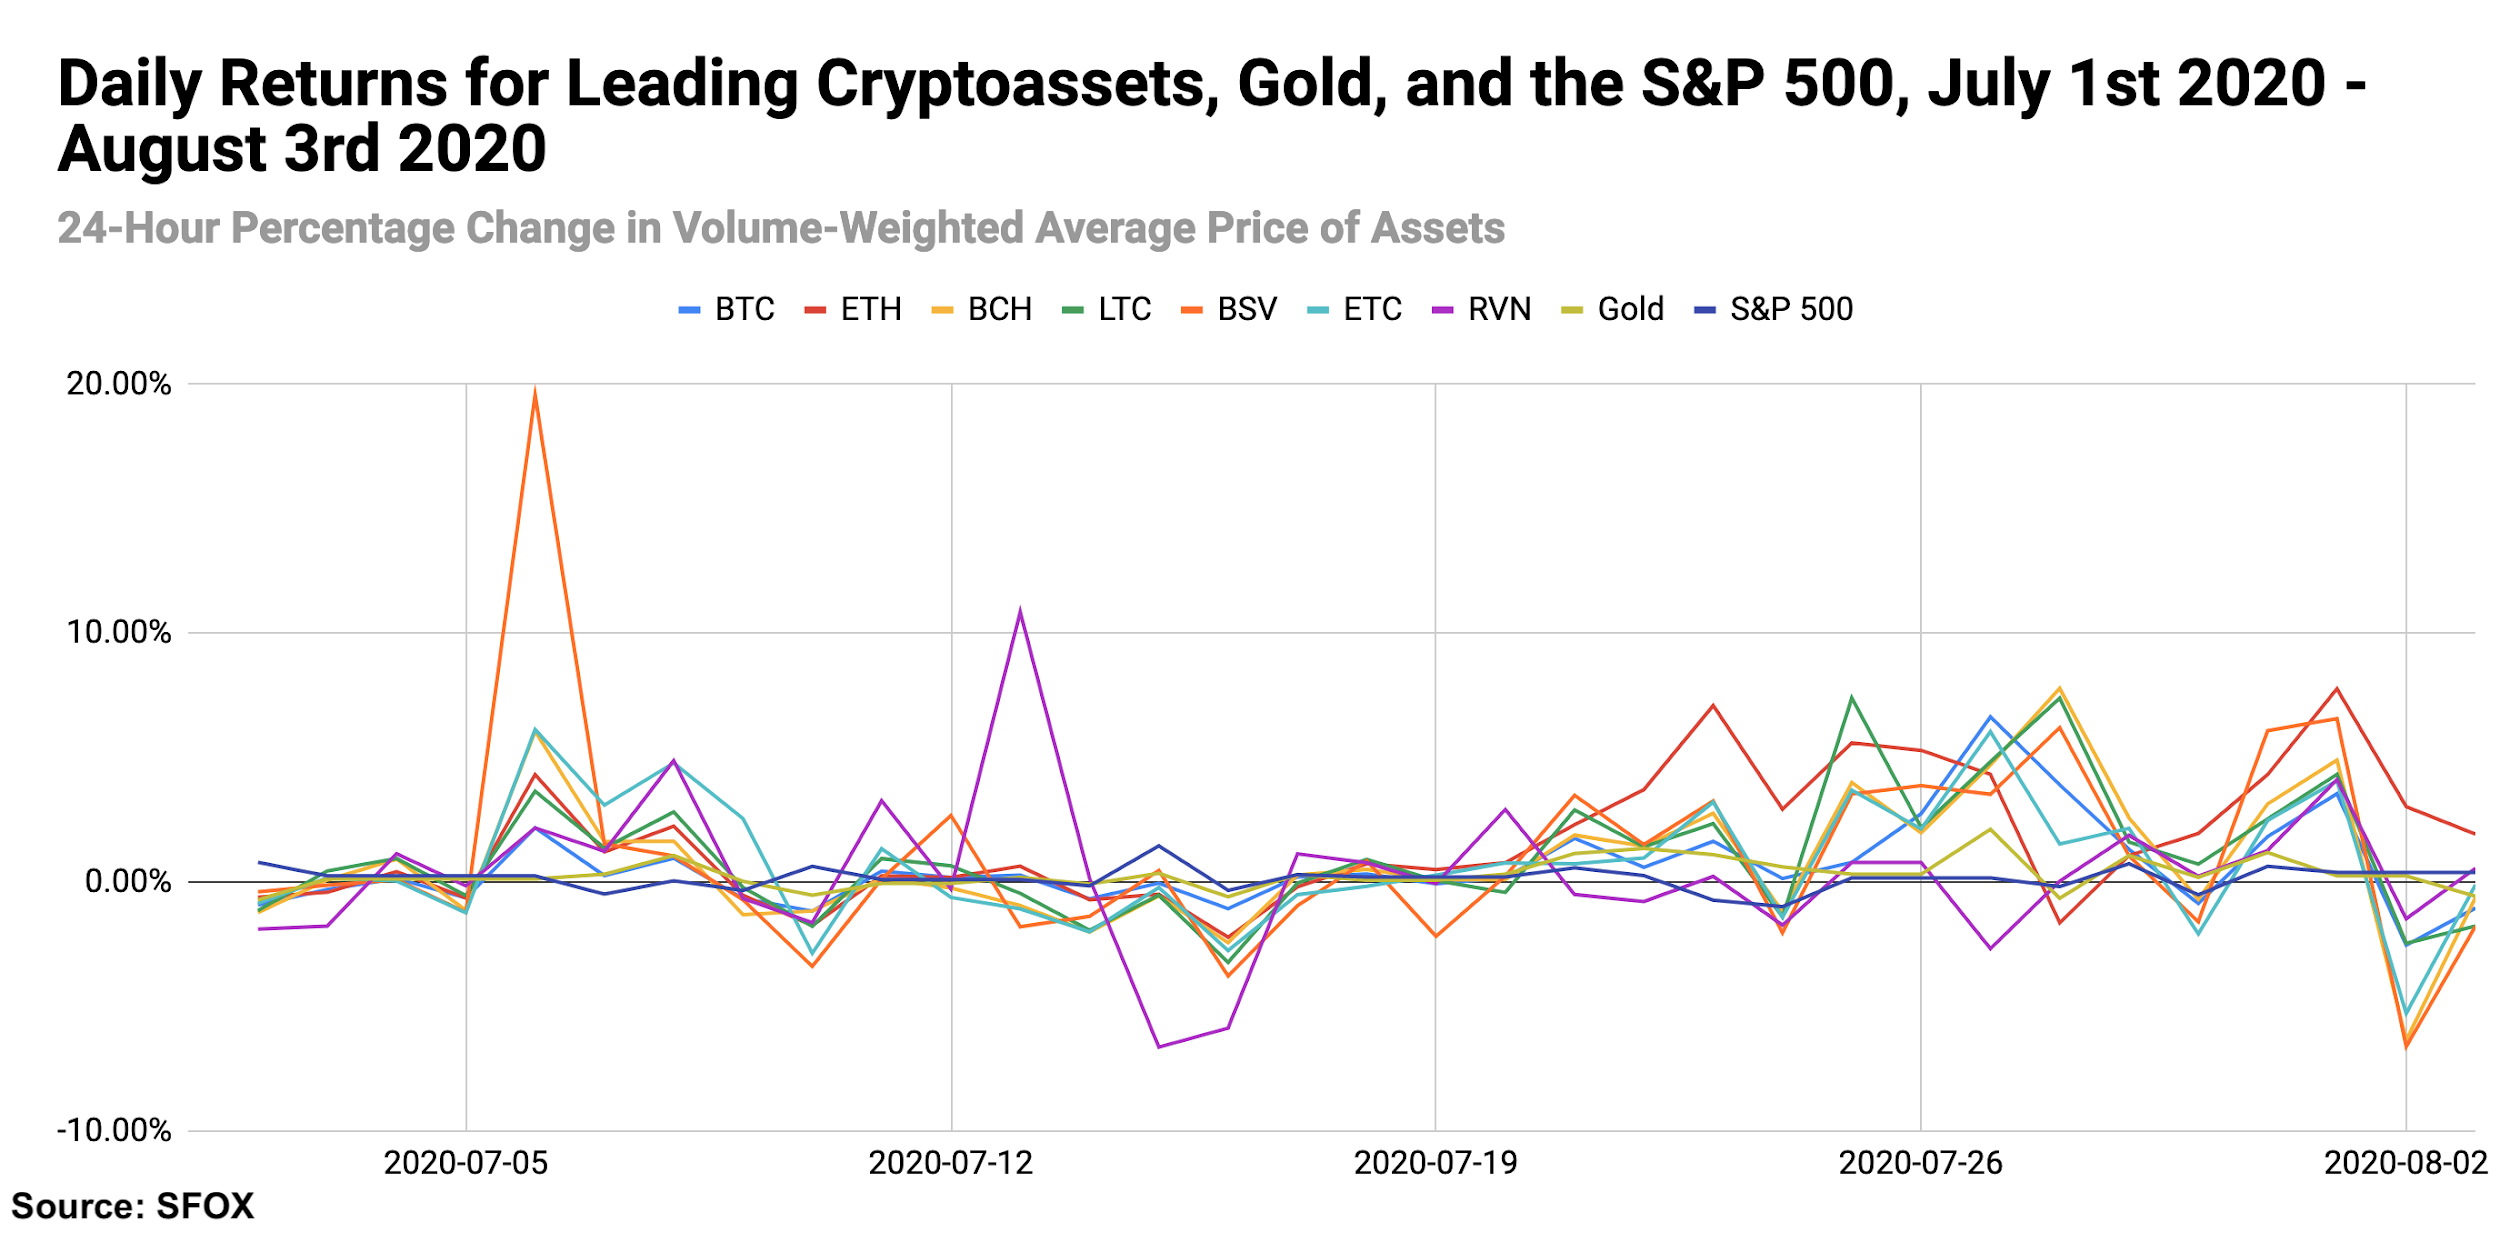
For greater graphical clarity, see this additional chart tracking only the daily returns of BTC, ETH, gold, and the S&P 500:
All the crypto assets available for trading on SFOX showed month-over-month gains as of August 3rd, along with the S&P 500 and gold. ETH stood out with the greatest gains (69.71%), consistent with its relative performance over the last three months. Perhaps surprisingly to some, BTC showed lower month-over month returns than ETH, BSV, LTC, BCH, and ETC (23.21%); RVN showed the lowest month-over-month returns in the report (14.71%).
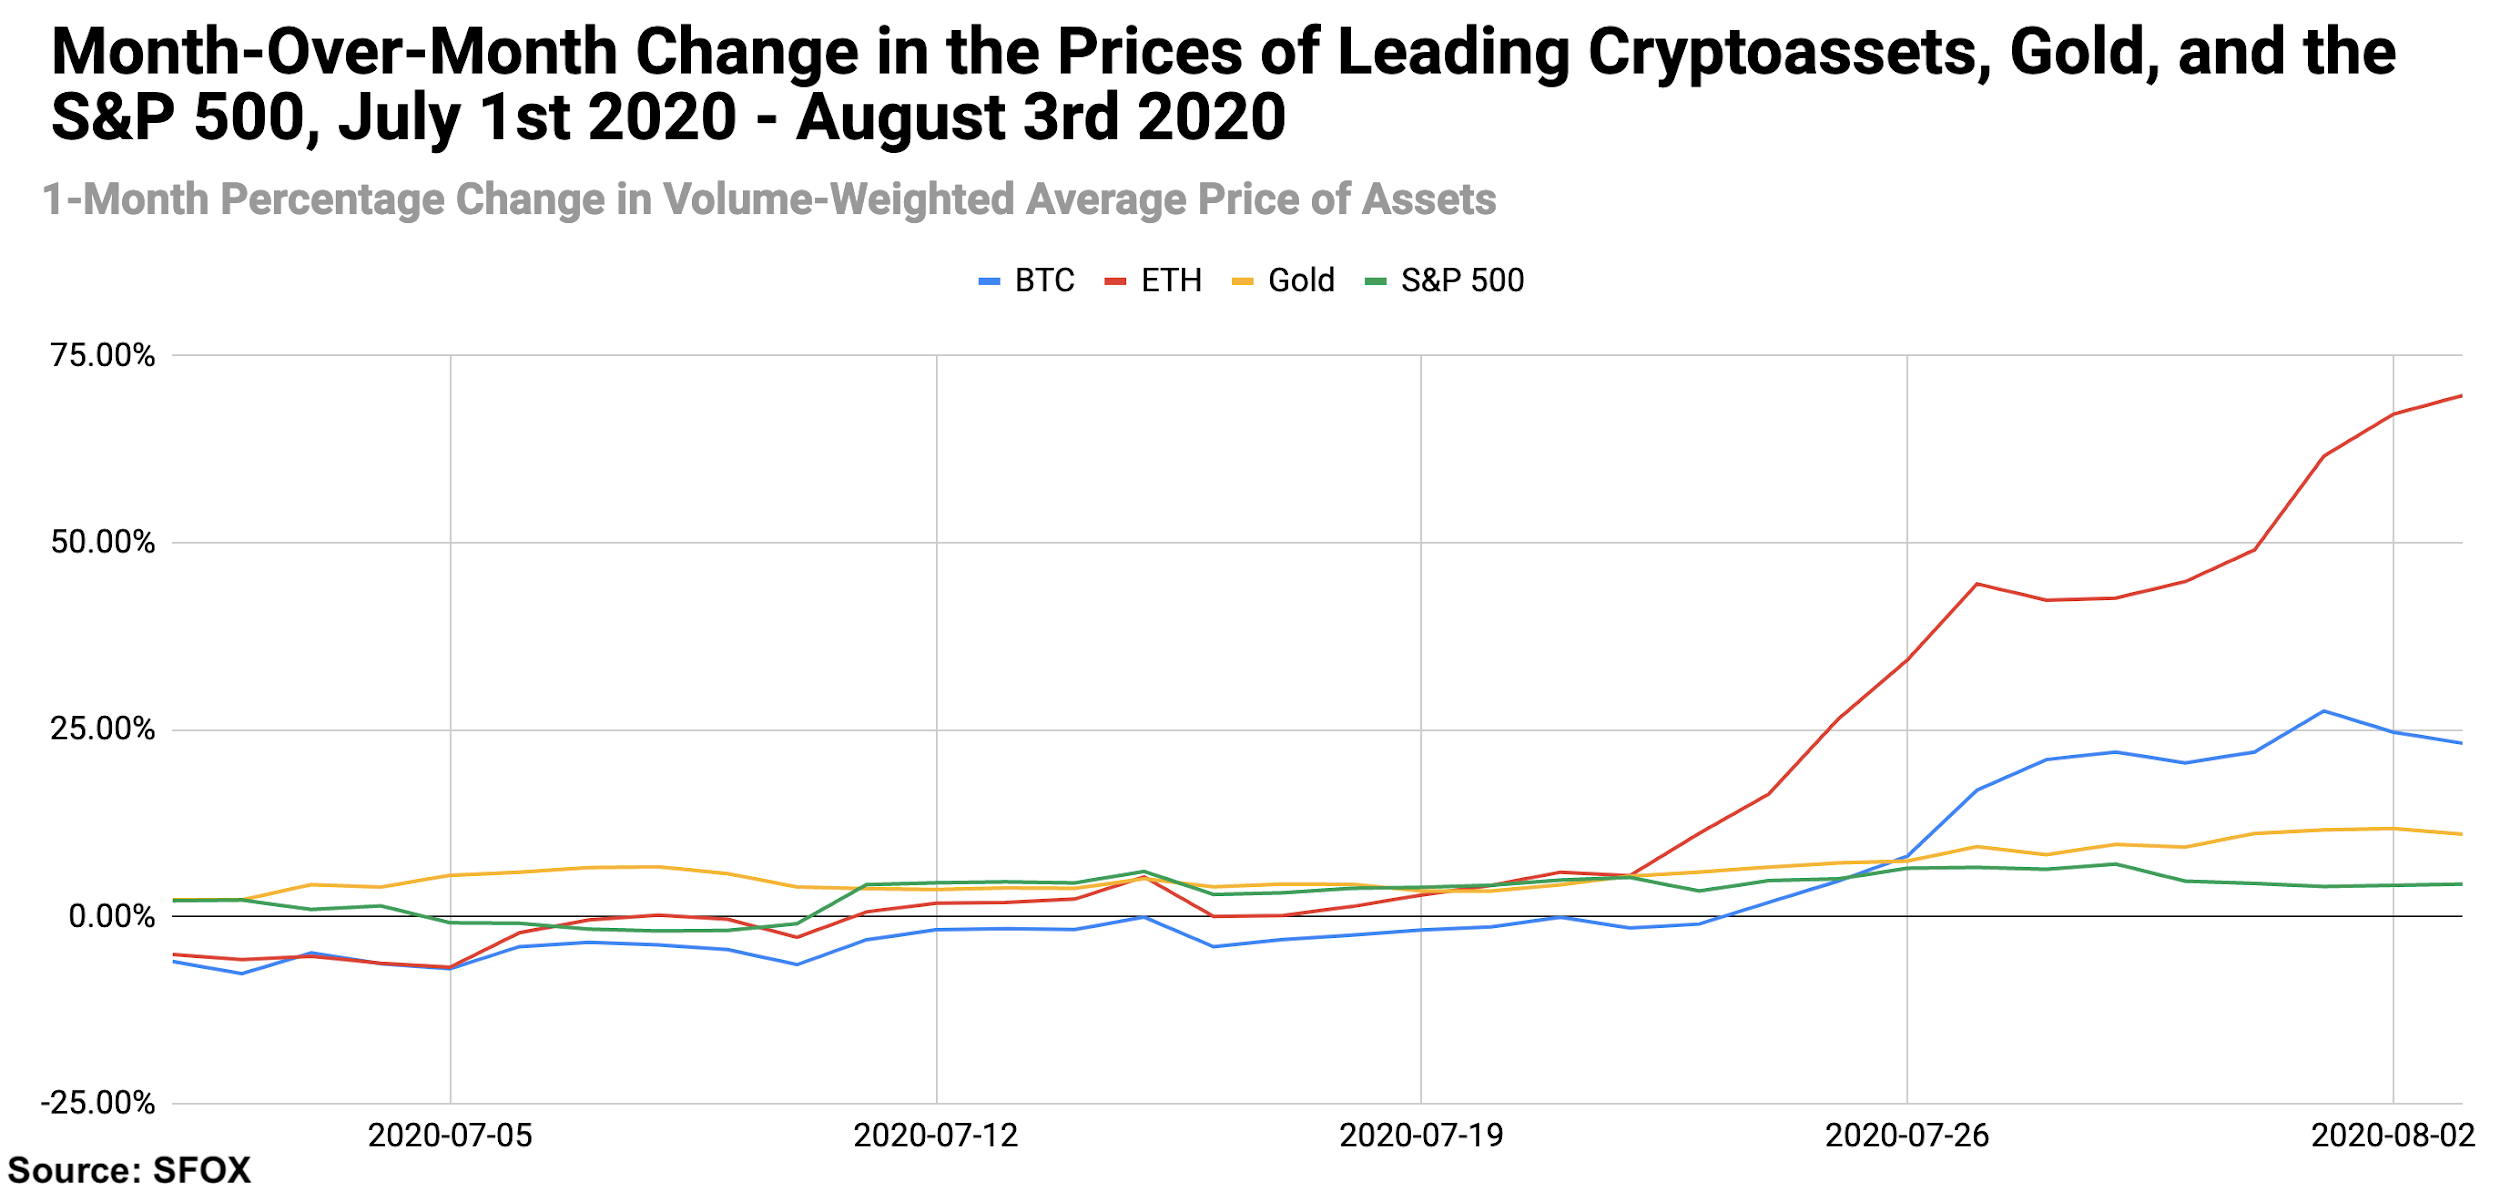
For greater graphical clarity, see this additional chart tracking only the month-over-month changes in the prices of BTC, ETH, gold, and the S&P 500:
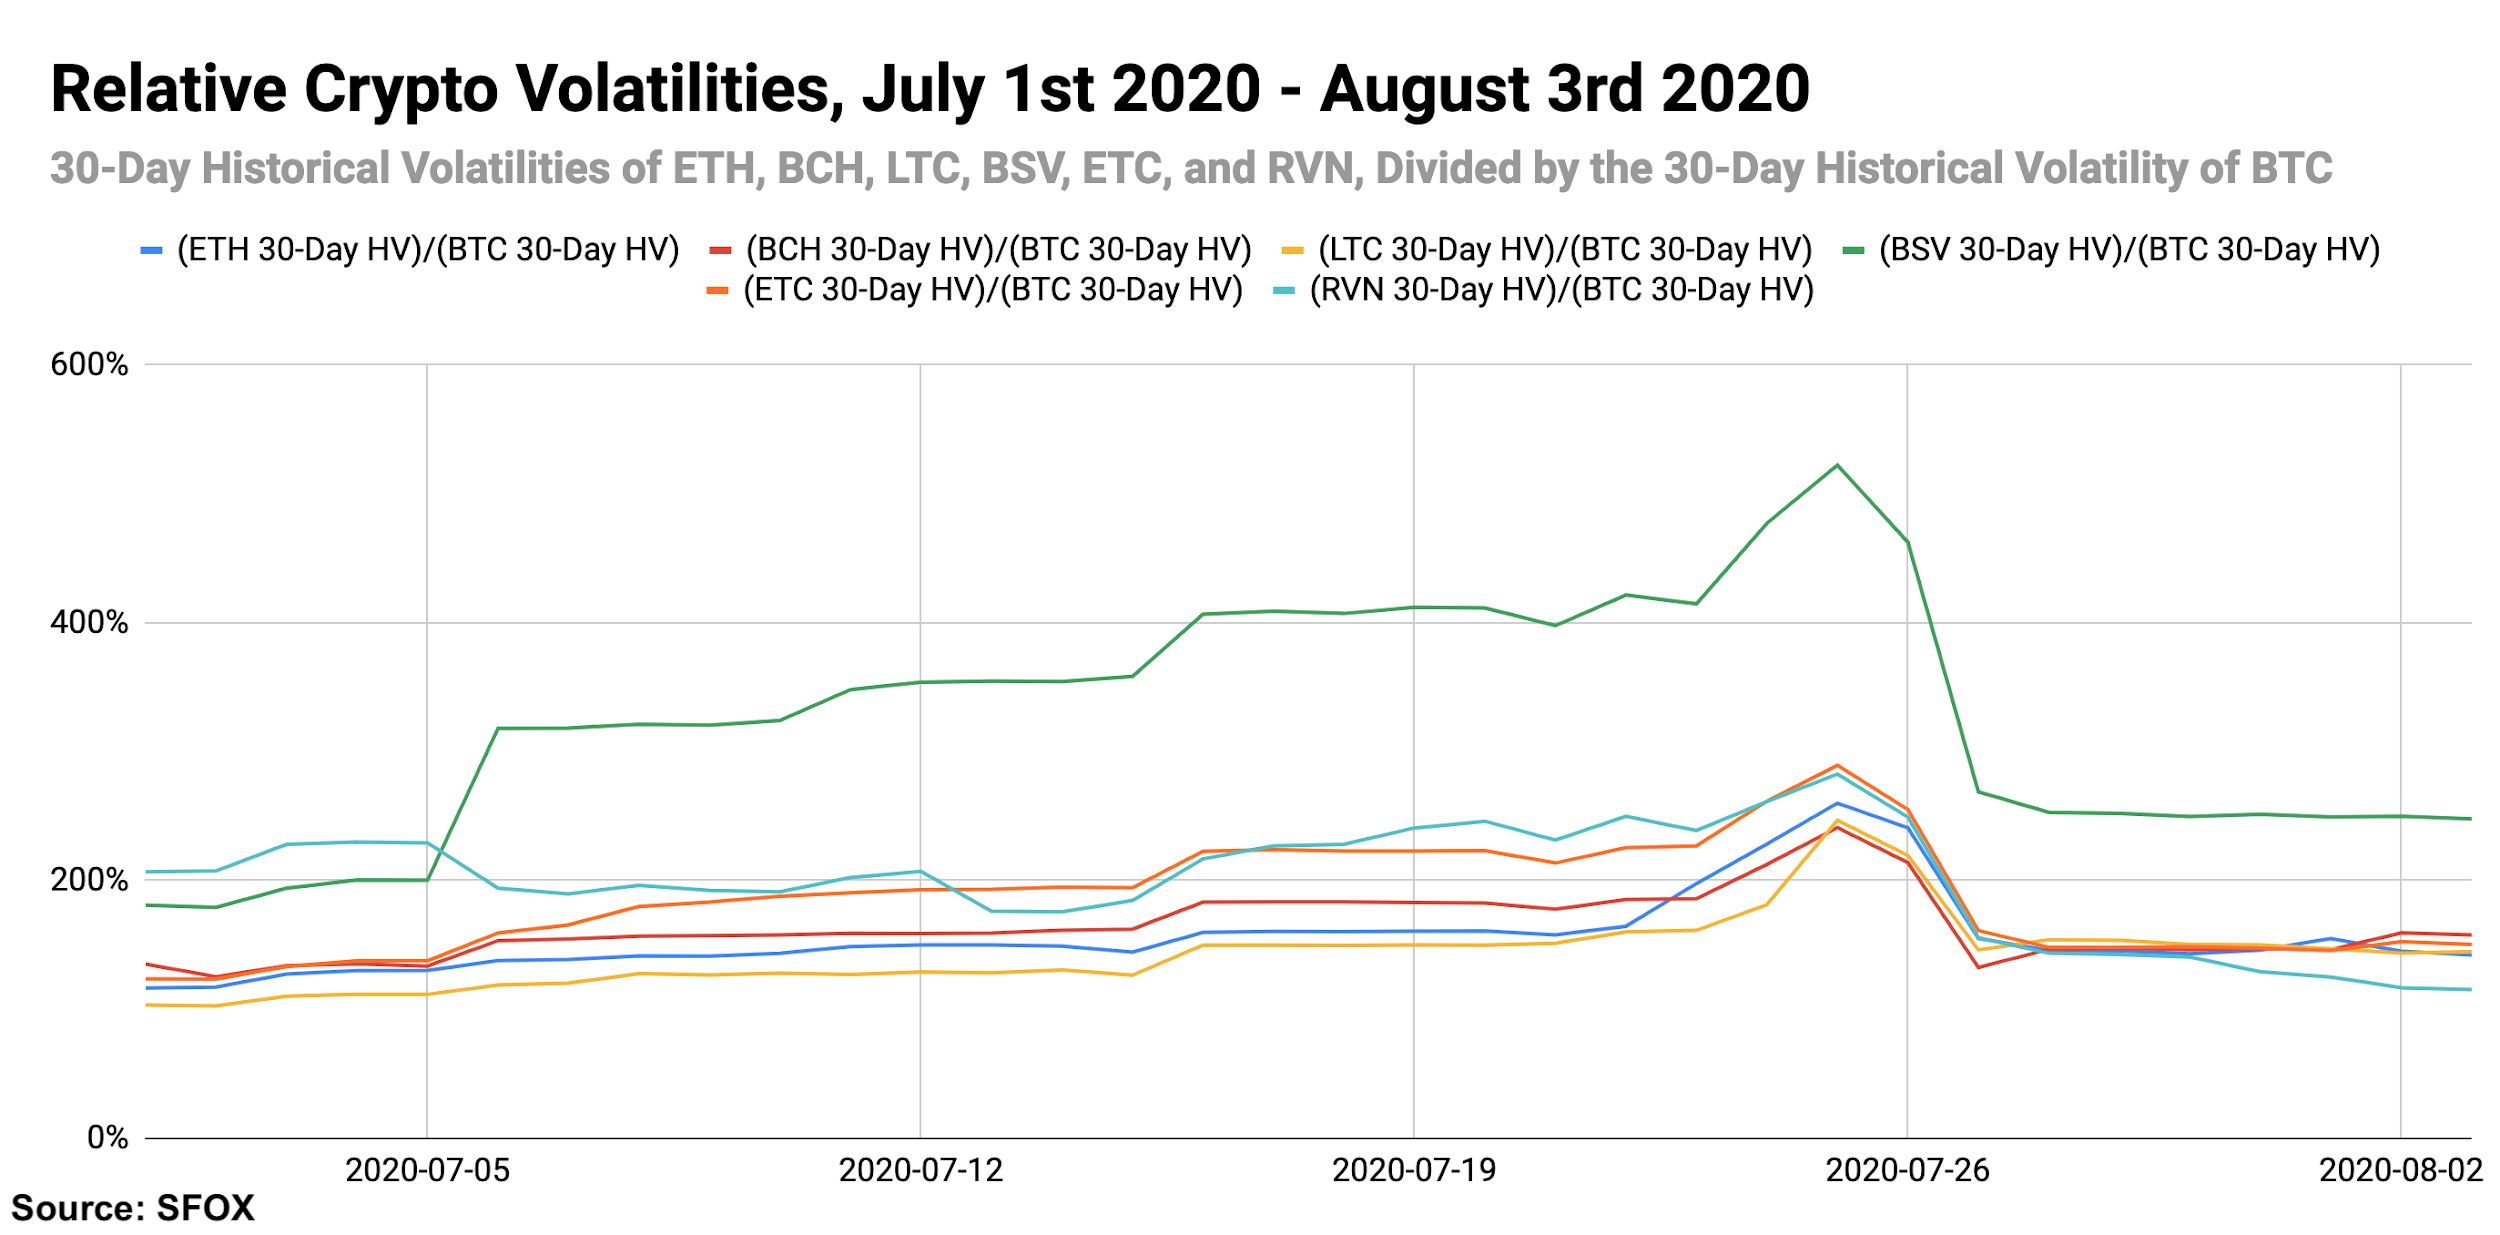
Volatility: Ramp-Up
While crypto volatility had generally been trending downward ahead of the recent rally, the rally itself appeared to reverse this trend. BTC’s 30-day historical volatility kicked off July at 27.15%; by July 25th, it had fallen to 15.56%; by August 3rd, it had risen to 33.34%.
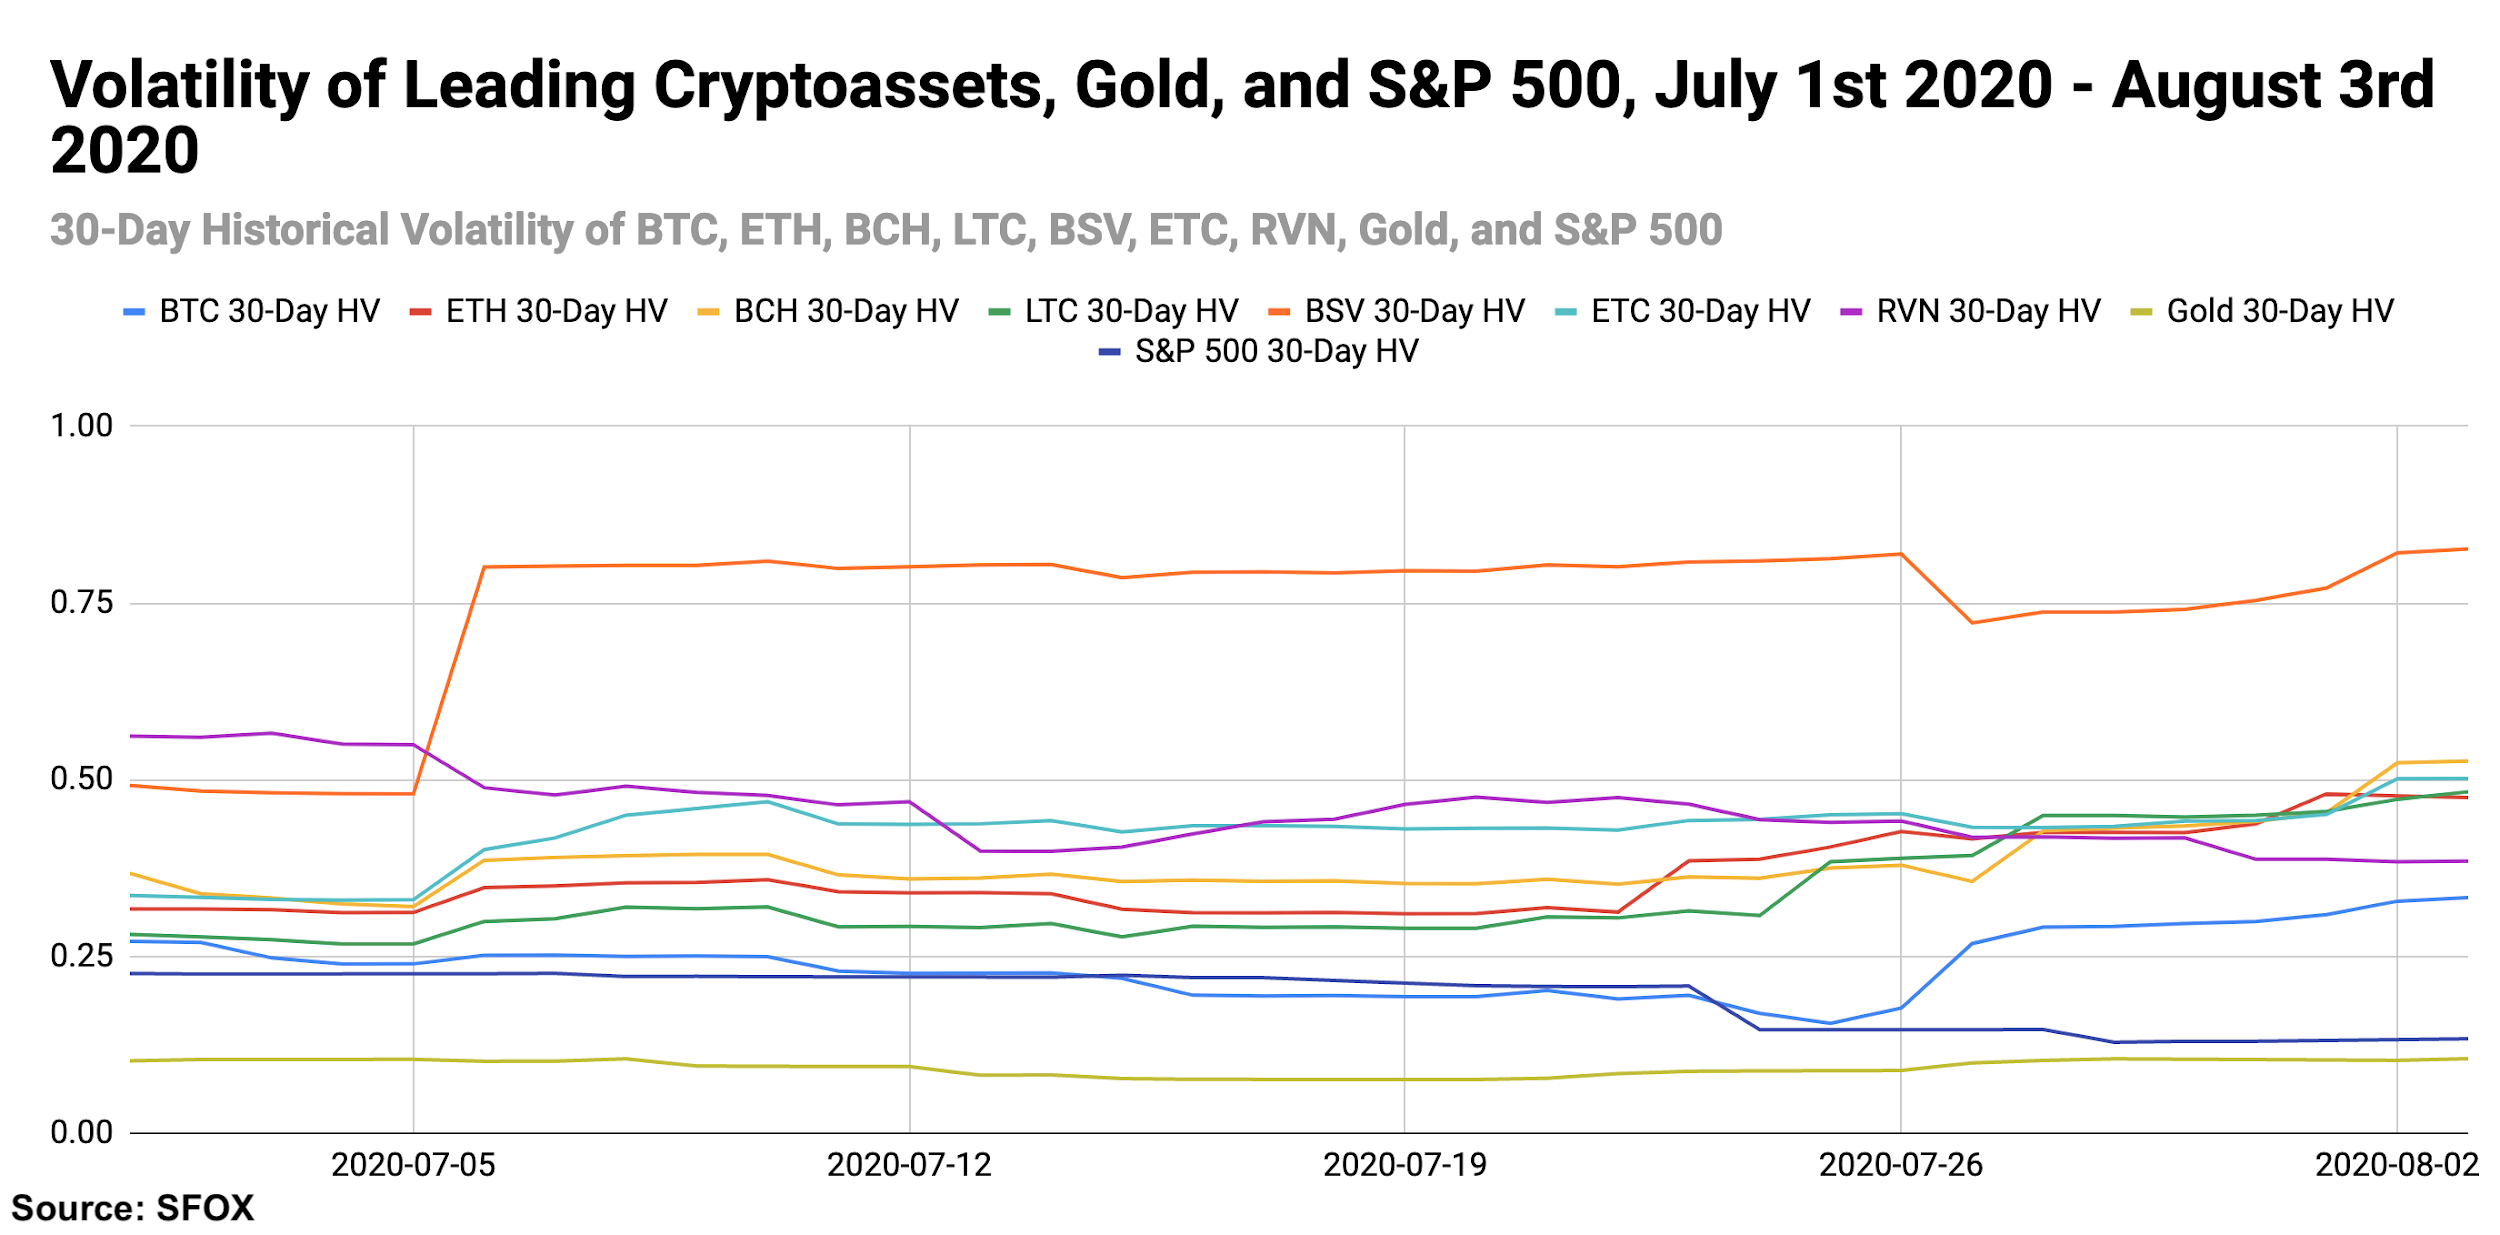
By looking at the 30-day historical volatilities of ETH, BCH, LTC, BSV, ETC, and RVN as a percentage of BTC’s 30-day historical volatility, we can see that BTC’s volatility summarily trumped those of altcoins from July 26th, the point of BTC’s rally, onward.
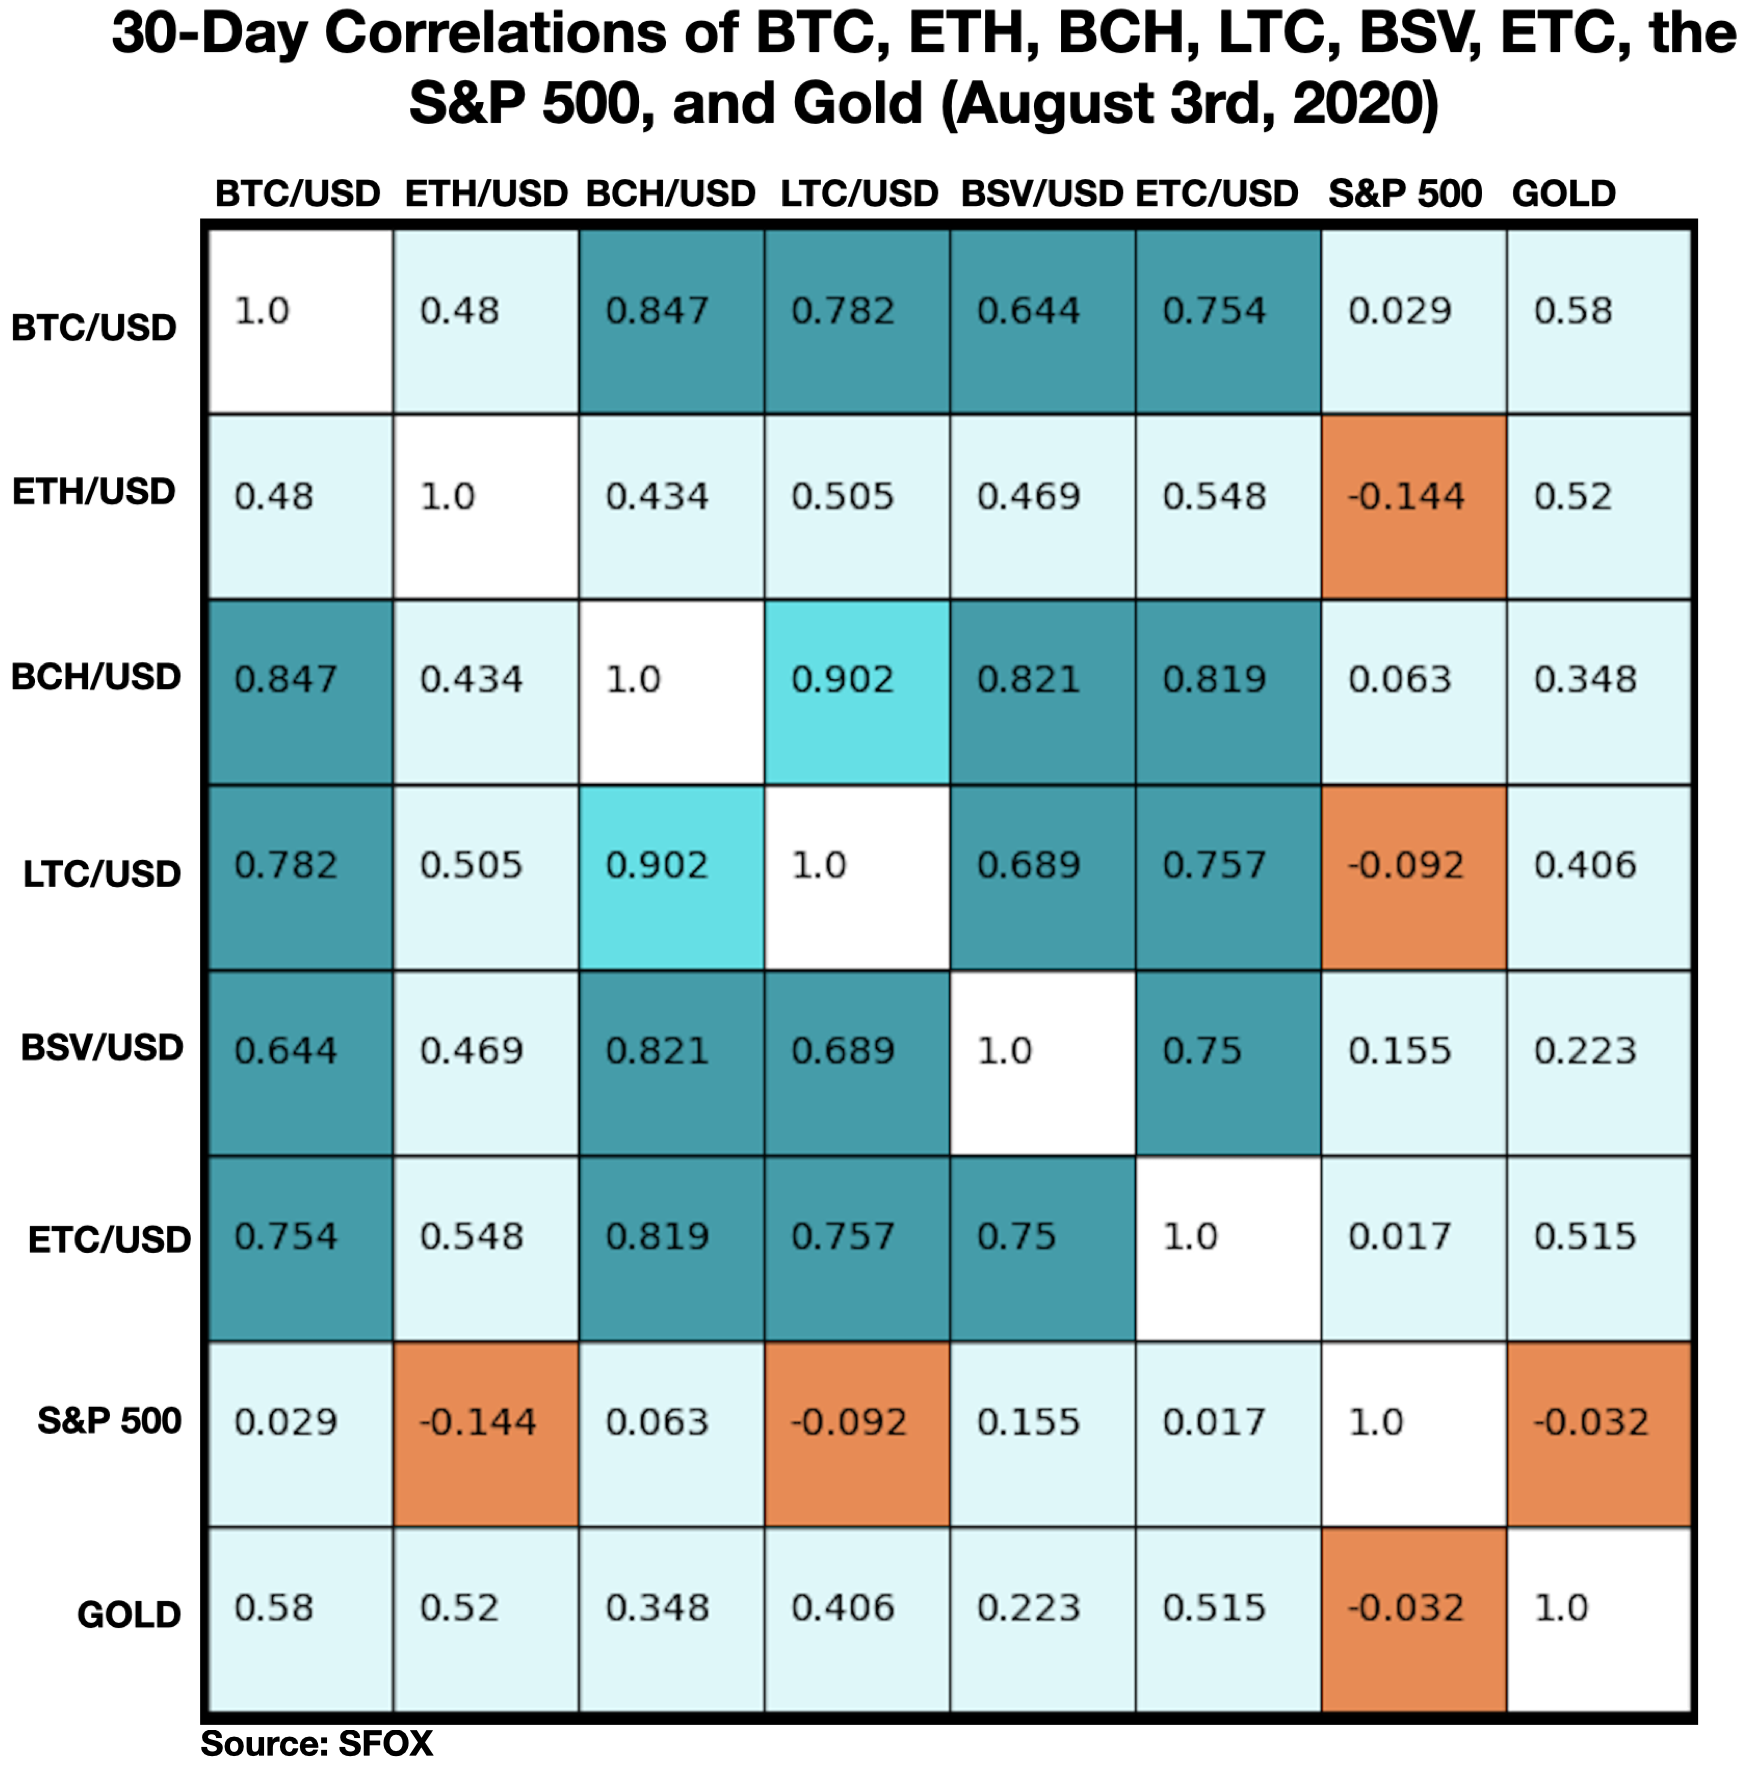
Price Correlations: The DeFi Apex?
The noteworthy story in this month’s correlation data is that ETH saw an atypically low correlation with other cryptocurrencies, including BTC. Some market participants may view this as validation that ETH-specific market factors like the rise of decentralized finance as an Ethereum-based sector and the coming move to staking in Ethereum 2.0 are making ETH an asset on its own terms rather than something that merely follows BTC.
See the full SFOX crypto correlations matrix below:
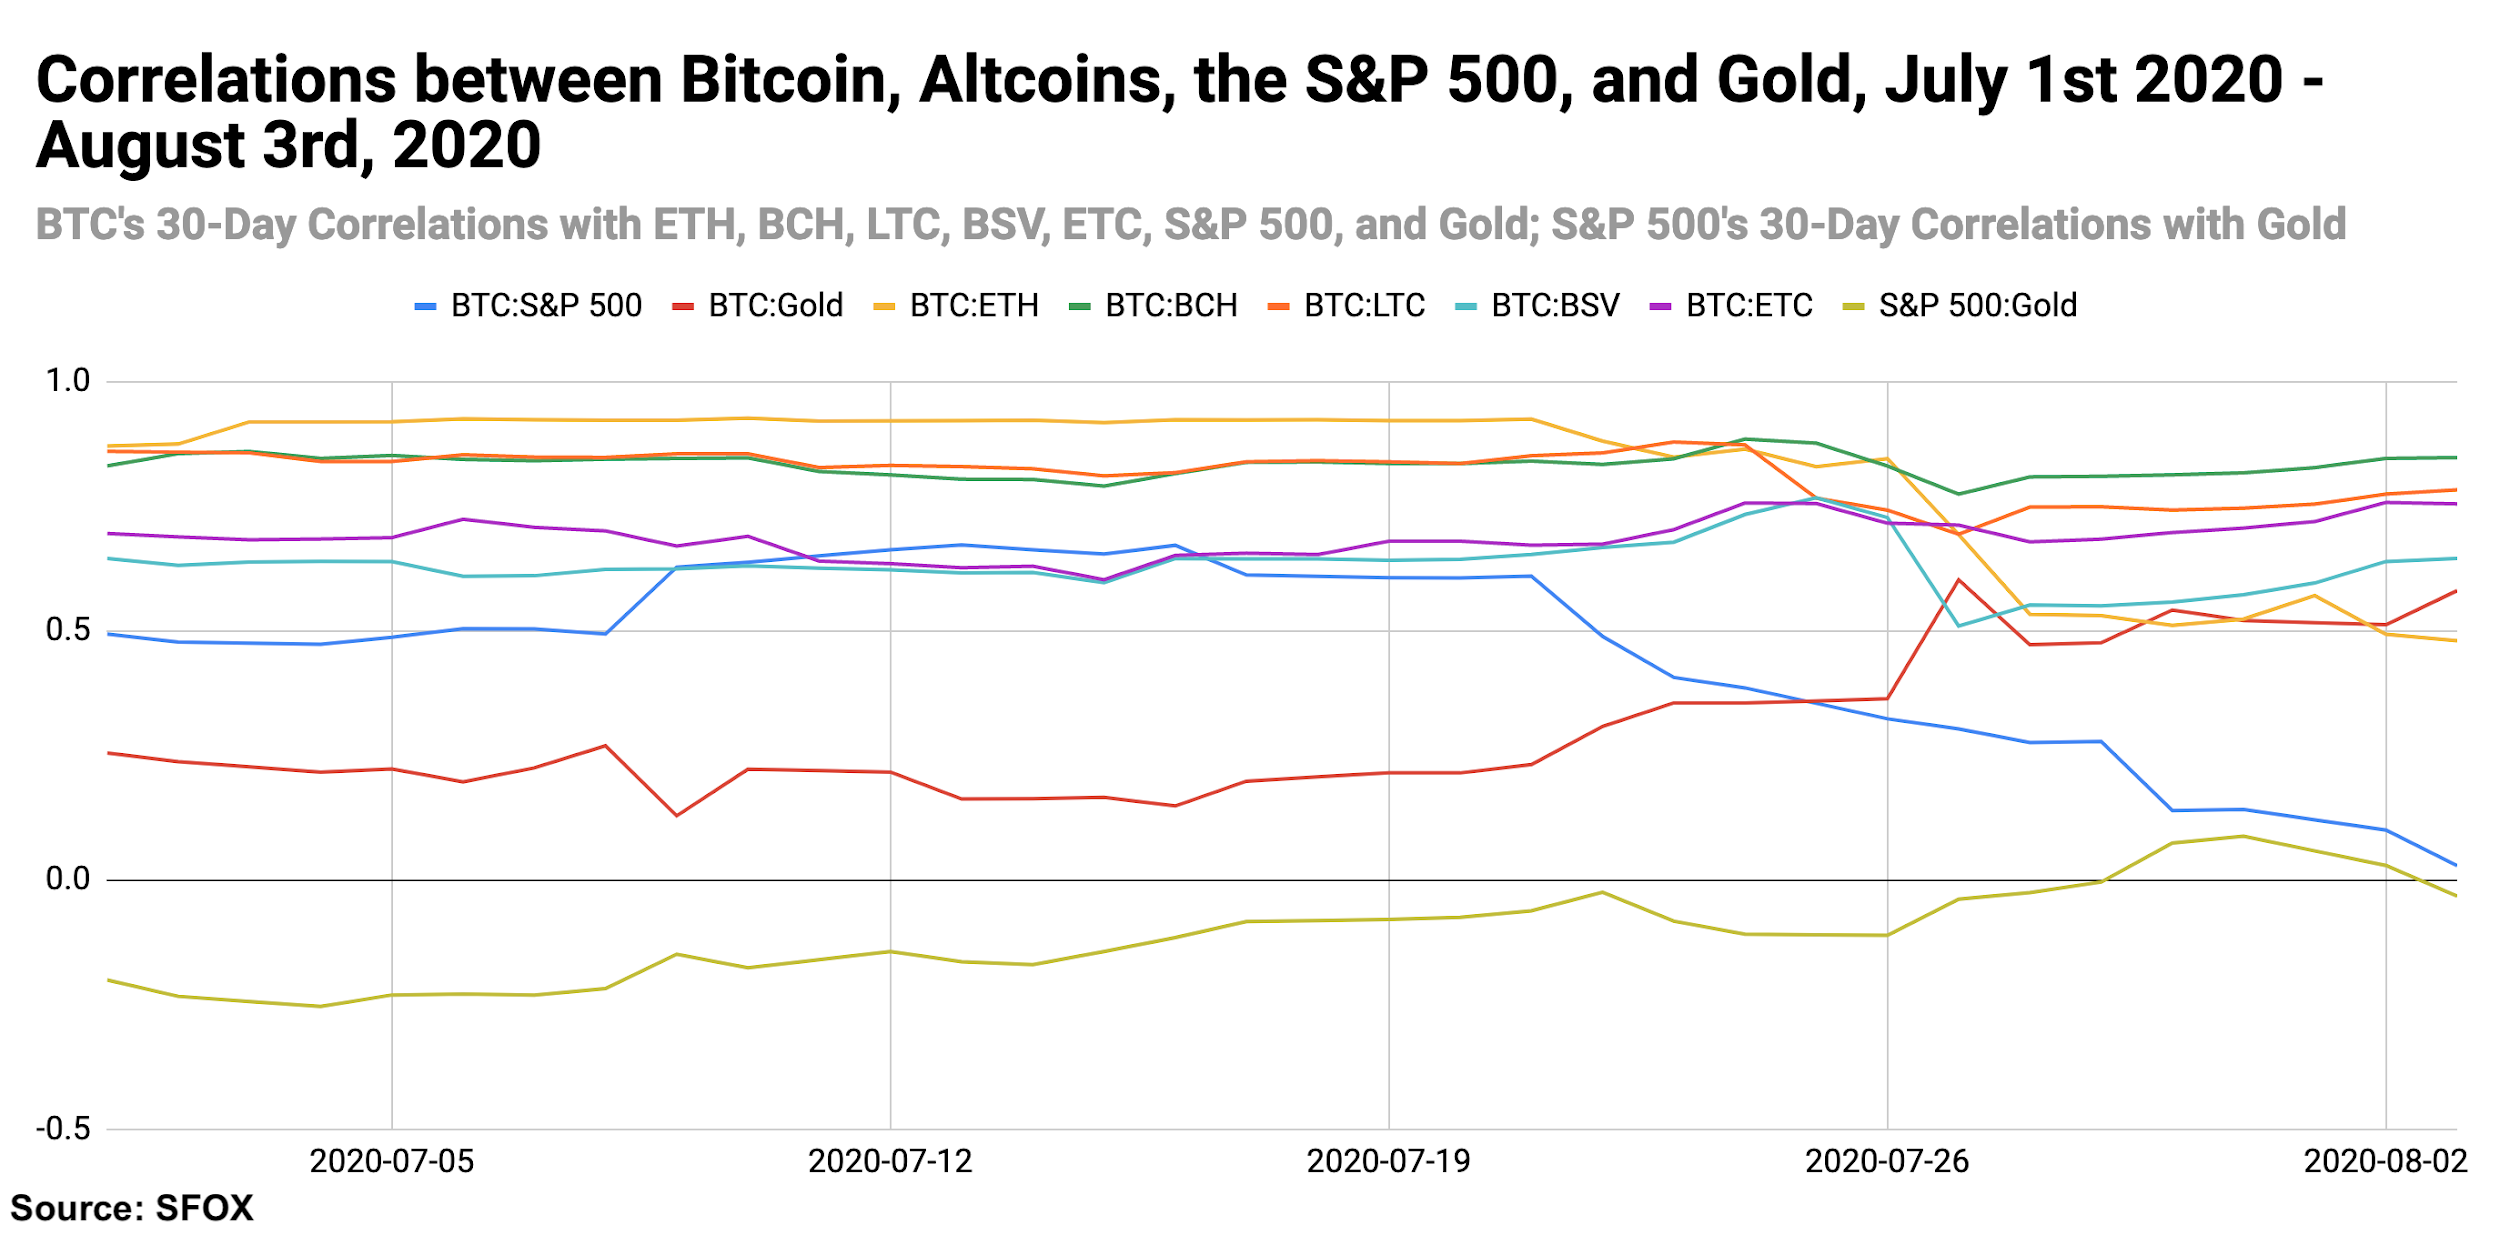
For a more complete look at BTC’s correlations with other assets throughout the past month, see the following graph:
Appendix: Data Sources, Definitions, and Methodology
All cryptocurrency prices are denominated in USD unless otherwise noted.
Note that data collection for RVN began on February 2nd of this year, which is why RVN is not yet featured in all data analyses. RVN is also denominated in USD for ease of analysis and comparison with other crypto assets, though most RVN trading currently happens in the RVN/BTC pair.
We use two different in-house volatility indices in creating these reports:
1. 30-day historical volatility (HV) indices are calculated from daily snapshots over the relevant 30-day period using the formula:
30-Day HV Index = σ(Ln(P1/P0), Ln(P2/P1), …, Ln(P30/P29)) * √(365)
2. Daily historical volatility (HV) indices are calculated from 1440 snapshots over the relevant 24-hour period using the formula:
Daily HV Index = σ(Ln(P1/P0), Ln(P2/P1), …, Ln(P1440/P1439))* √(1440)
S&P 500 performance data are collected from Yahoo! Finance using GSPC (S&P 500 Index) data. Gold performance data are collected from Yahoo! Finance using GC=F (June 2020 gold futures contract) data.
30-day asset correlations are calculated using the Pearson method, in accordance with the following formula:
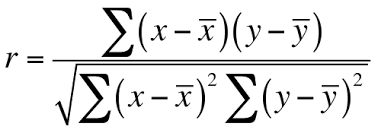
In our calculations, x = 30-day returns for BTC/USD, y = 30-day returns for the other asset in consideration, and r = the correlation coefficient between BTC and the other asset in consideration.
The crypto asset data sources aggregated for crypto prices, correlations, and volatility indices presented and analyzed in this report are the following eight exchanges, the order-book data of which we collect and store in real time:
- bitFlyer
- Binance
- Bitstamp
- Bittrex
- Coinbase
- Gemini
- itBit
- Kraken
Our indices’ integration of data from multiple top liquidity providers offers a more holistic view of the crypto market’s minute-to-minute movement. There are two problems with looking to any single liquidity provider for marketwide data:
- Different liquidity providers experience widely varying trade volumes. For example: according to CoinMarketCap, Binance saw over $20 billion USD in trading volume in November 2018, whereas Bitstamp saw $2 billion USD in trading volume in that same time — an order-of-magnitude difference. Therefore, treating any single liquidity provider’s data as representative of the overall market is myopic.
- Liquidity providers routinely experience interruptions in data collection. For instance, virtually every exchange undergoes regularly scheduled maintenance at one point or another, at which point their order books are unavailable and they therefore have no market data to collect or report. At best, this can prevent analysts from getting a full picture of market performance; at worst, it can make it virtually impossible to build metrics such as historical volatility indices.
Building volatility indices that collect real-time data from many distinct liquidity providers mitigates both of these problems: collecting and averaging data from different sources prevents any single source from having an outsized impact on our view of the market, and it also allows us to still have data for analysis even if one or two of those sources experience interruptions. We use five redundant data collection mechanisms for each exchange in order to ensure that our data collection will remain uninterrupted even in the event of multiple failures.