Summary:
- The SFOX Multi-Factor Market Index has been updated from neutral to mildly bullish as of June 8th.
- A positive U.S. jobs report coincided with a rise in the S&P 500 and a dip in BTC, but don’t call them correlated.
- The volatility levels of major cryptocurrencies seem to be trending towards more homogeneity, but it’s too early to identify this as a long-term trend.
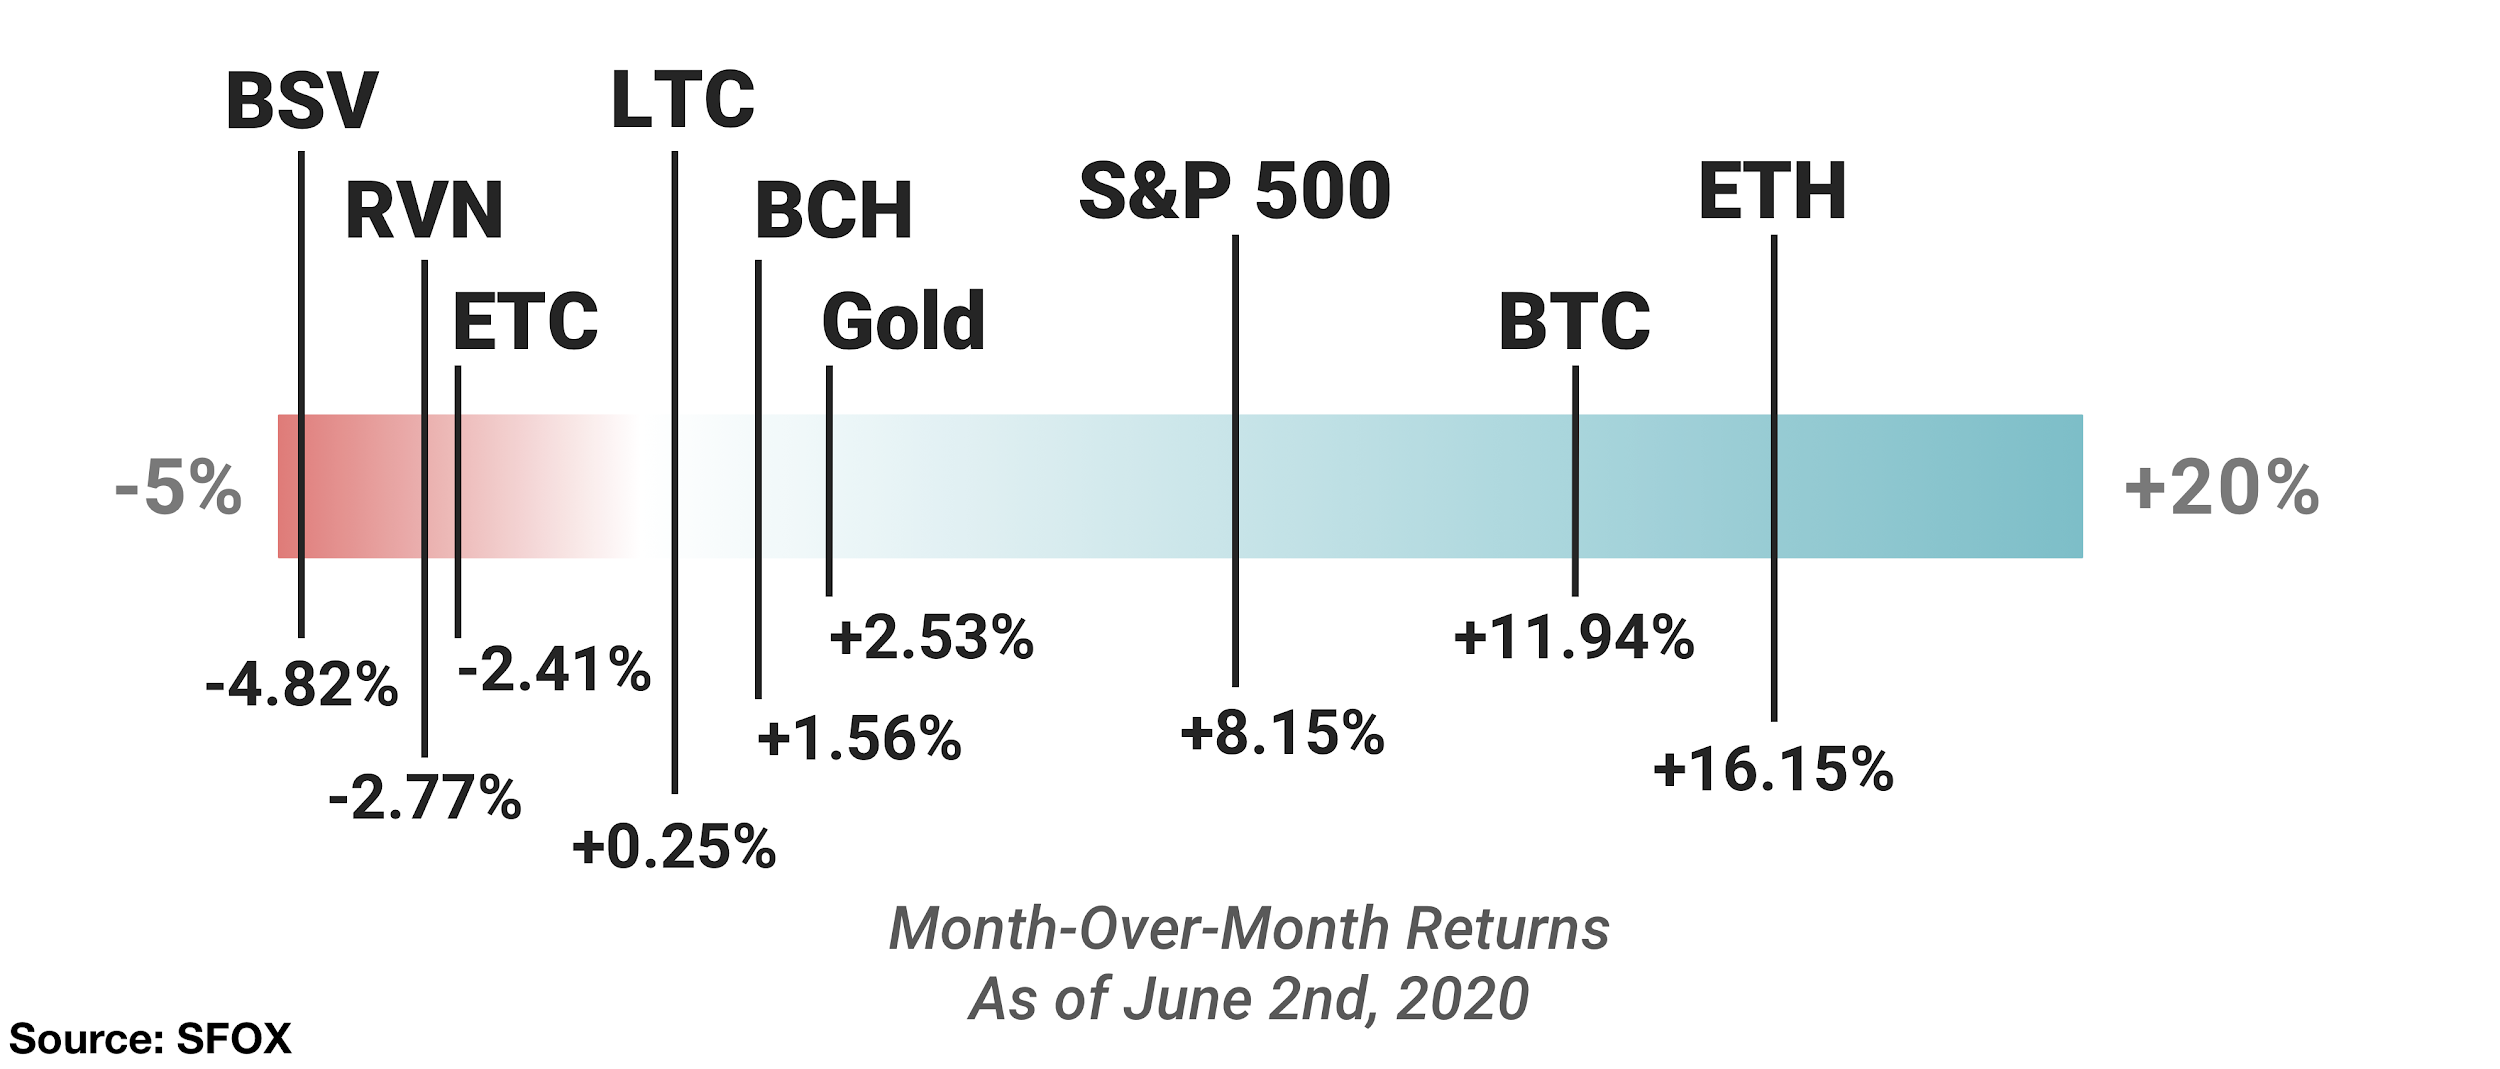
- In the beginning of June, ETH, BTC, BCH, LTC, gold, and the S&P 500 are up month-over-month; ETC, BSV, and RVN are down month-over-month. ETH had the highest MoM returns (16.15%); BSV had the greatest losses (4.82%).
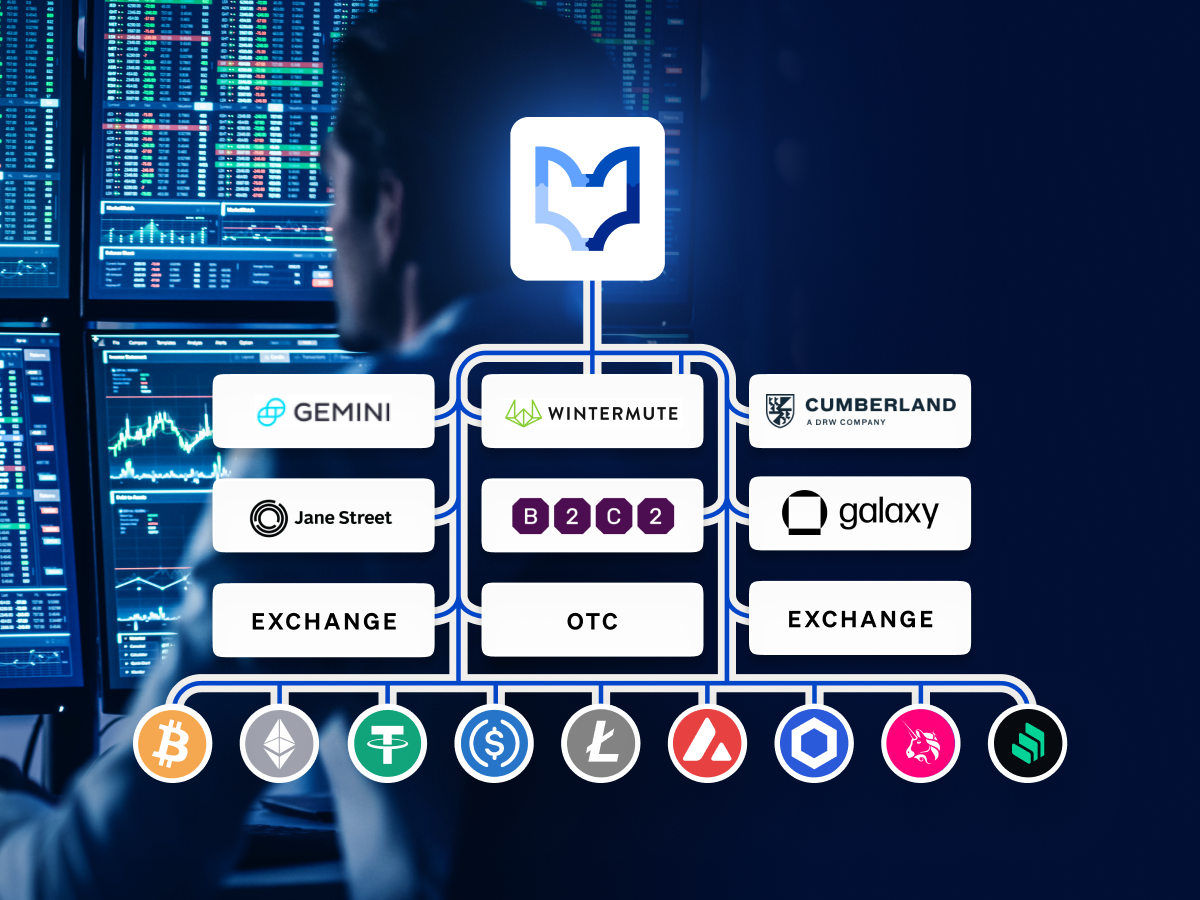
In the June 2020 edition of the SFOX crypto market report, the SFOX Research Team reviews the crypto market’s volatility, correlations, and other performance metrics throughout the past month. We’ve aggregated price, volume, correlations, and volatility data from eight leading exchanges and liquidity providers to analyze the global performance of 7 major crypto assets — BTC, ETH, BCH, LTC, BSV, ETC, and RVN — all of which are available for smart-routing-powered trading on our trading platform.
The following is a report and analysis of their volatility, price correlations, and further development in the month of May and early June. (For more information on data sources and methodology, please consult the appendix at the end of the report.)
SFOX’s Current Crypto Market Outlook: Mildly Bullish
Based on our calculations and analyses, the SFOX Multi-Factor Market Index, which was set at neutral a month ago, has been updated to mildly bullish as of June 8th, 2020.
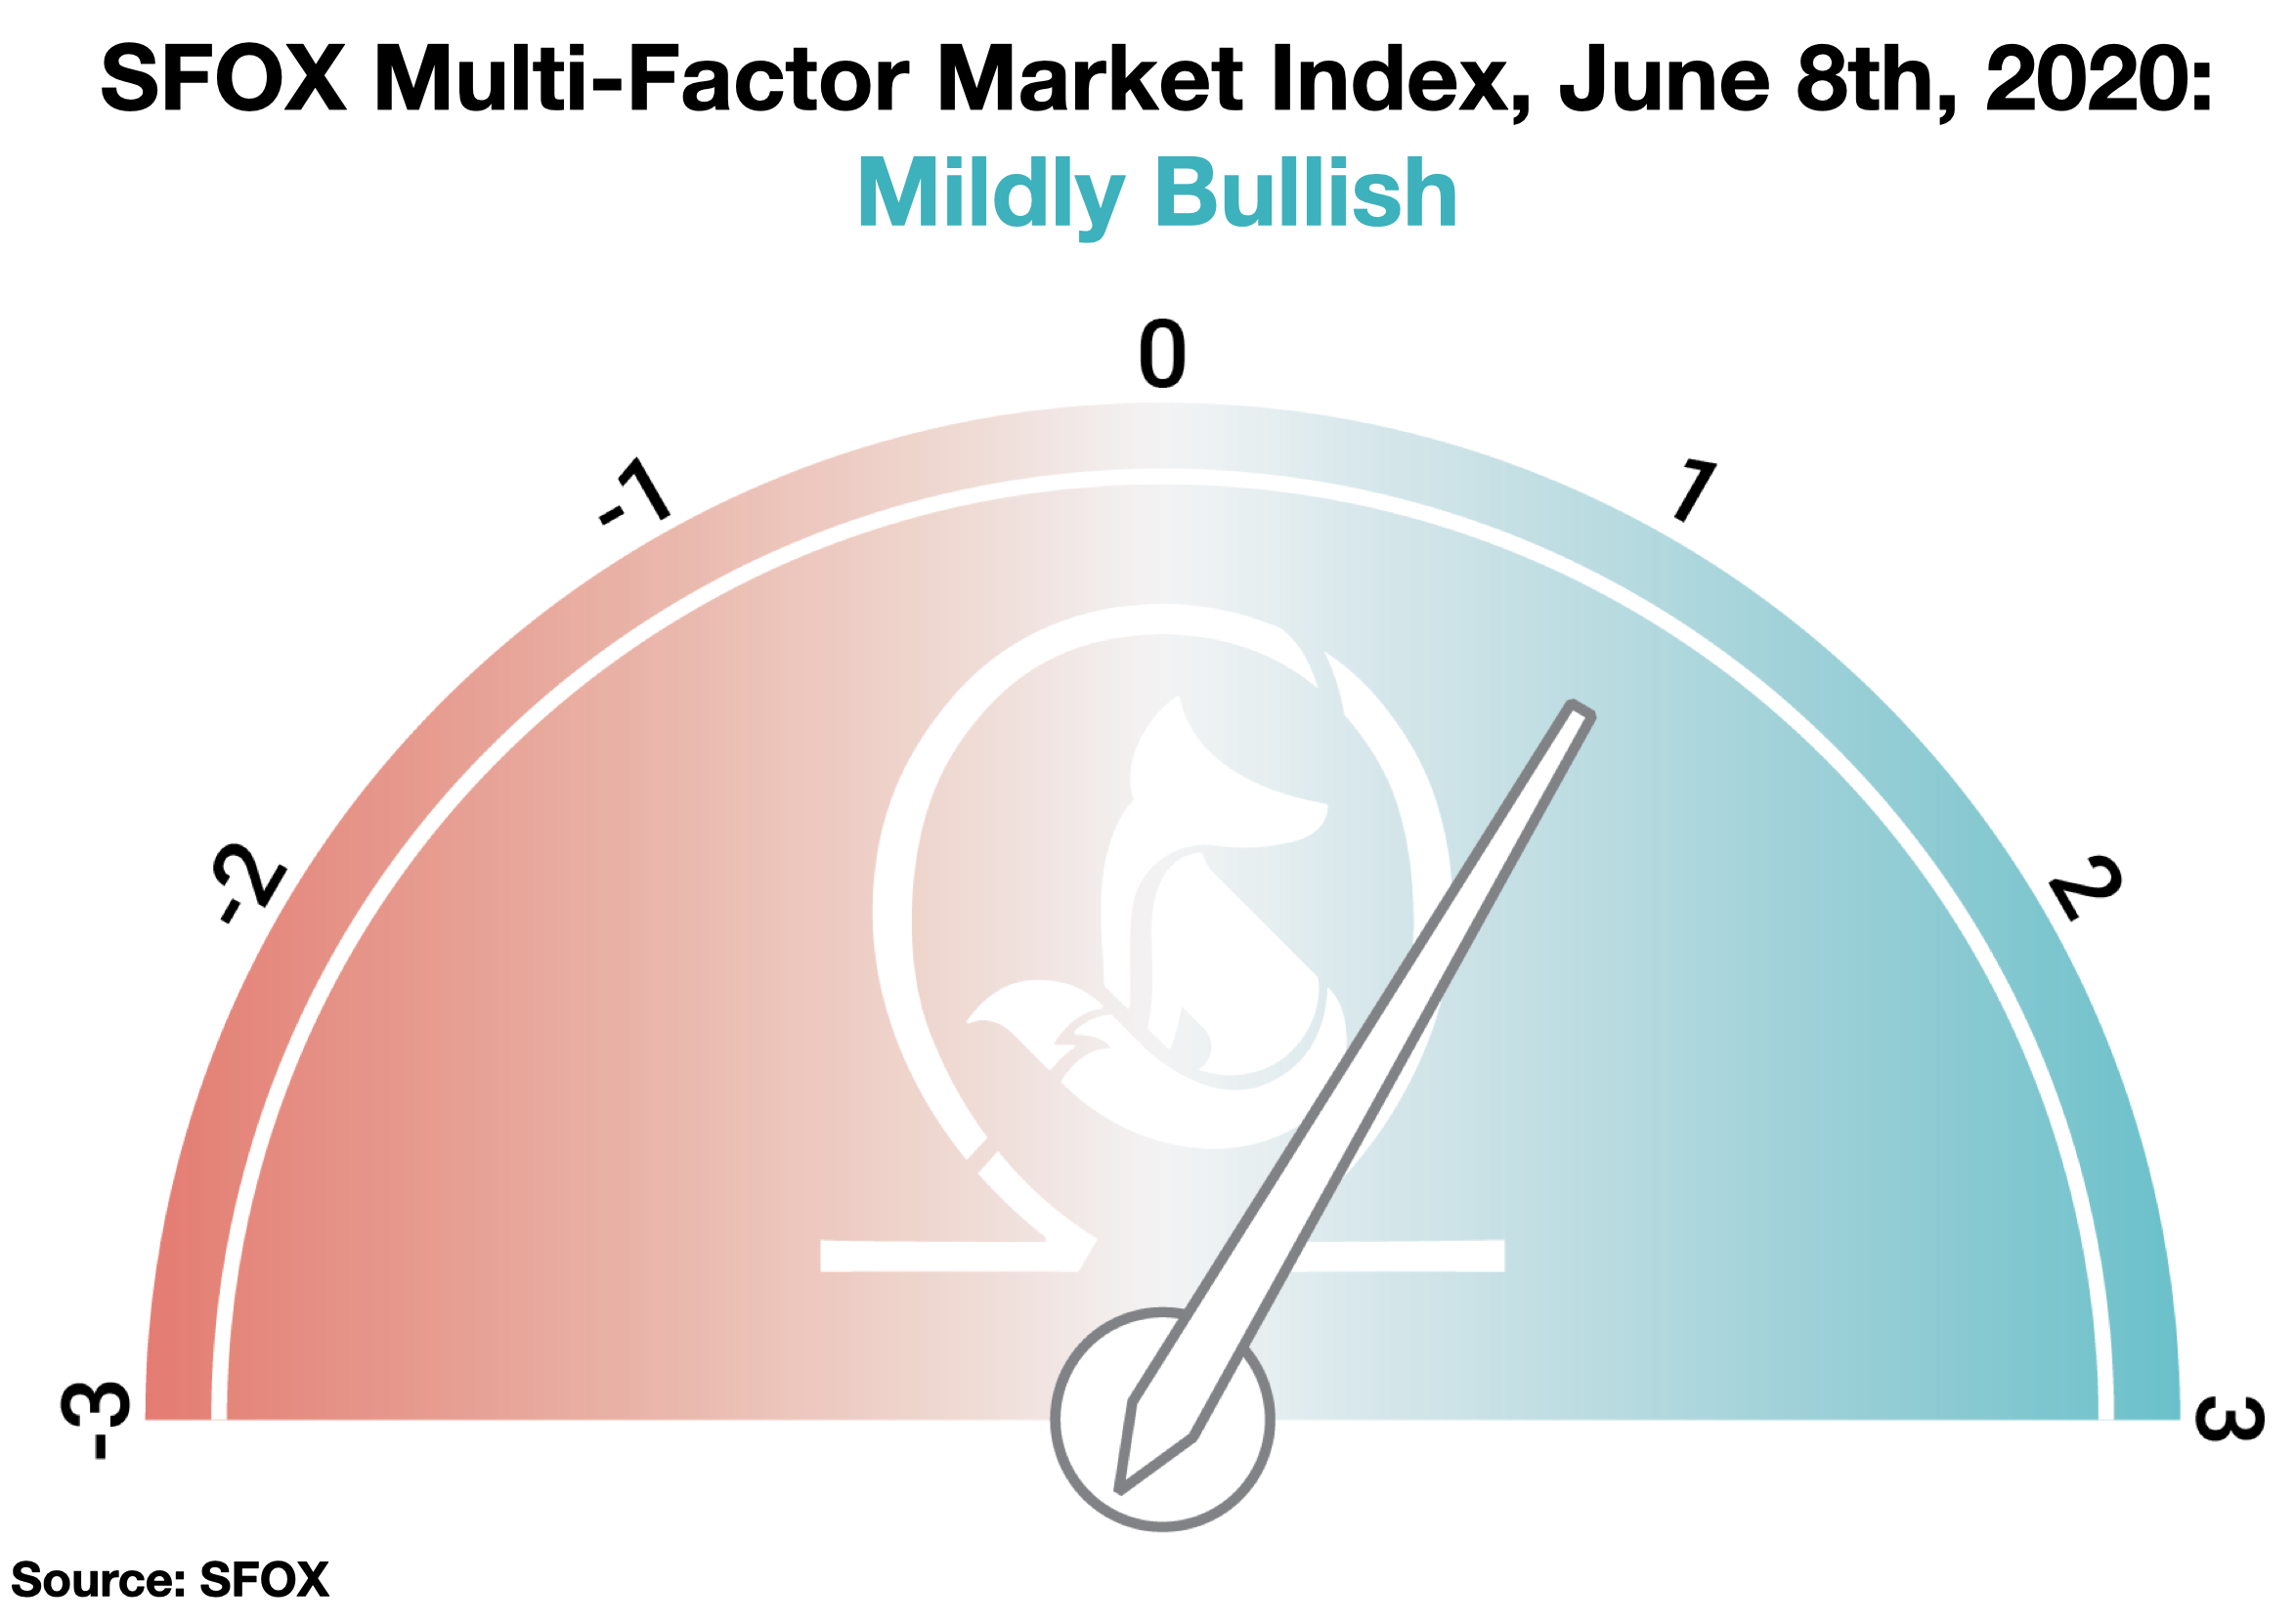
We determine the monthly value of this index by using proprietary, quantifiable indicators to analyze five market factors: price momentum, trade volume, market sentiment, volatility, and continued advancement of the sector. It is calculated using a proprietary formula that combines quantified, marketwide data on asset performance, search traffic, blockchain transactions, and more. The index ranges from highly bearish to highly bullish.
Among the crypto assets available for trading on SFOX, ETH, BTC, BCH, and LTC showed positive month-over-month returns as of June 2nd, along with the S&P 500 and gold. ETC, RVN, and BSV showed month-over-month losses. For the second time in a row, Ether (ETH) stood out with the highest month-over-month returns (16.15%), while BSV showed the greatest losses (4.82%).
Over the last three months, we’ve seen the outlook index get upgraded from mildly bearish to neutral to mildly bullish. While we’ve seen increased uncertainty and instability in multiple nations, sectors, and asset classes, that uncertainty and instability could potentially be leading more investors to be interested in the value proposition of cryptocurrencies and blockchain technology. As we discuss below, there’s evidence in the growth of DeFi and Wall Street interest like J.P. Morgan that interest in crypto is again on the rise; however, as persistent exchange failures, restrictive crypto legislation, and an unclear timeline to Ethereum 2.0 show, there’s still plenty of uncertainty left regarding the future of crypto.
Get the SFOX edge in volatile times through our smart-routing order types that capture the best available crypto prices from all major trading venues directly from your SFOX account.
What’s Happened in the Last Month and What to Watch Next
Markets
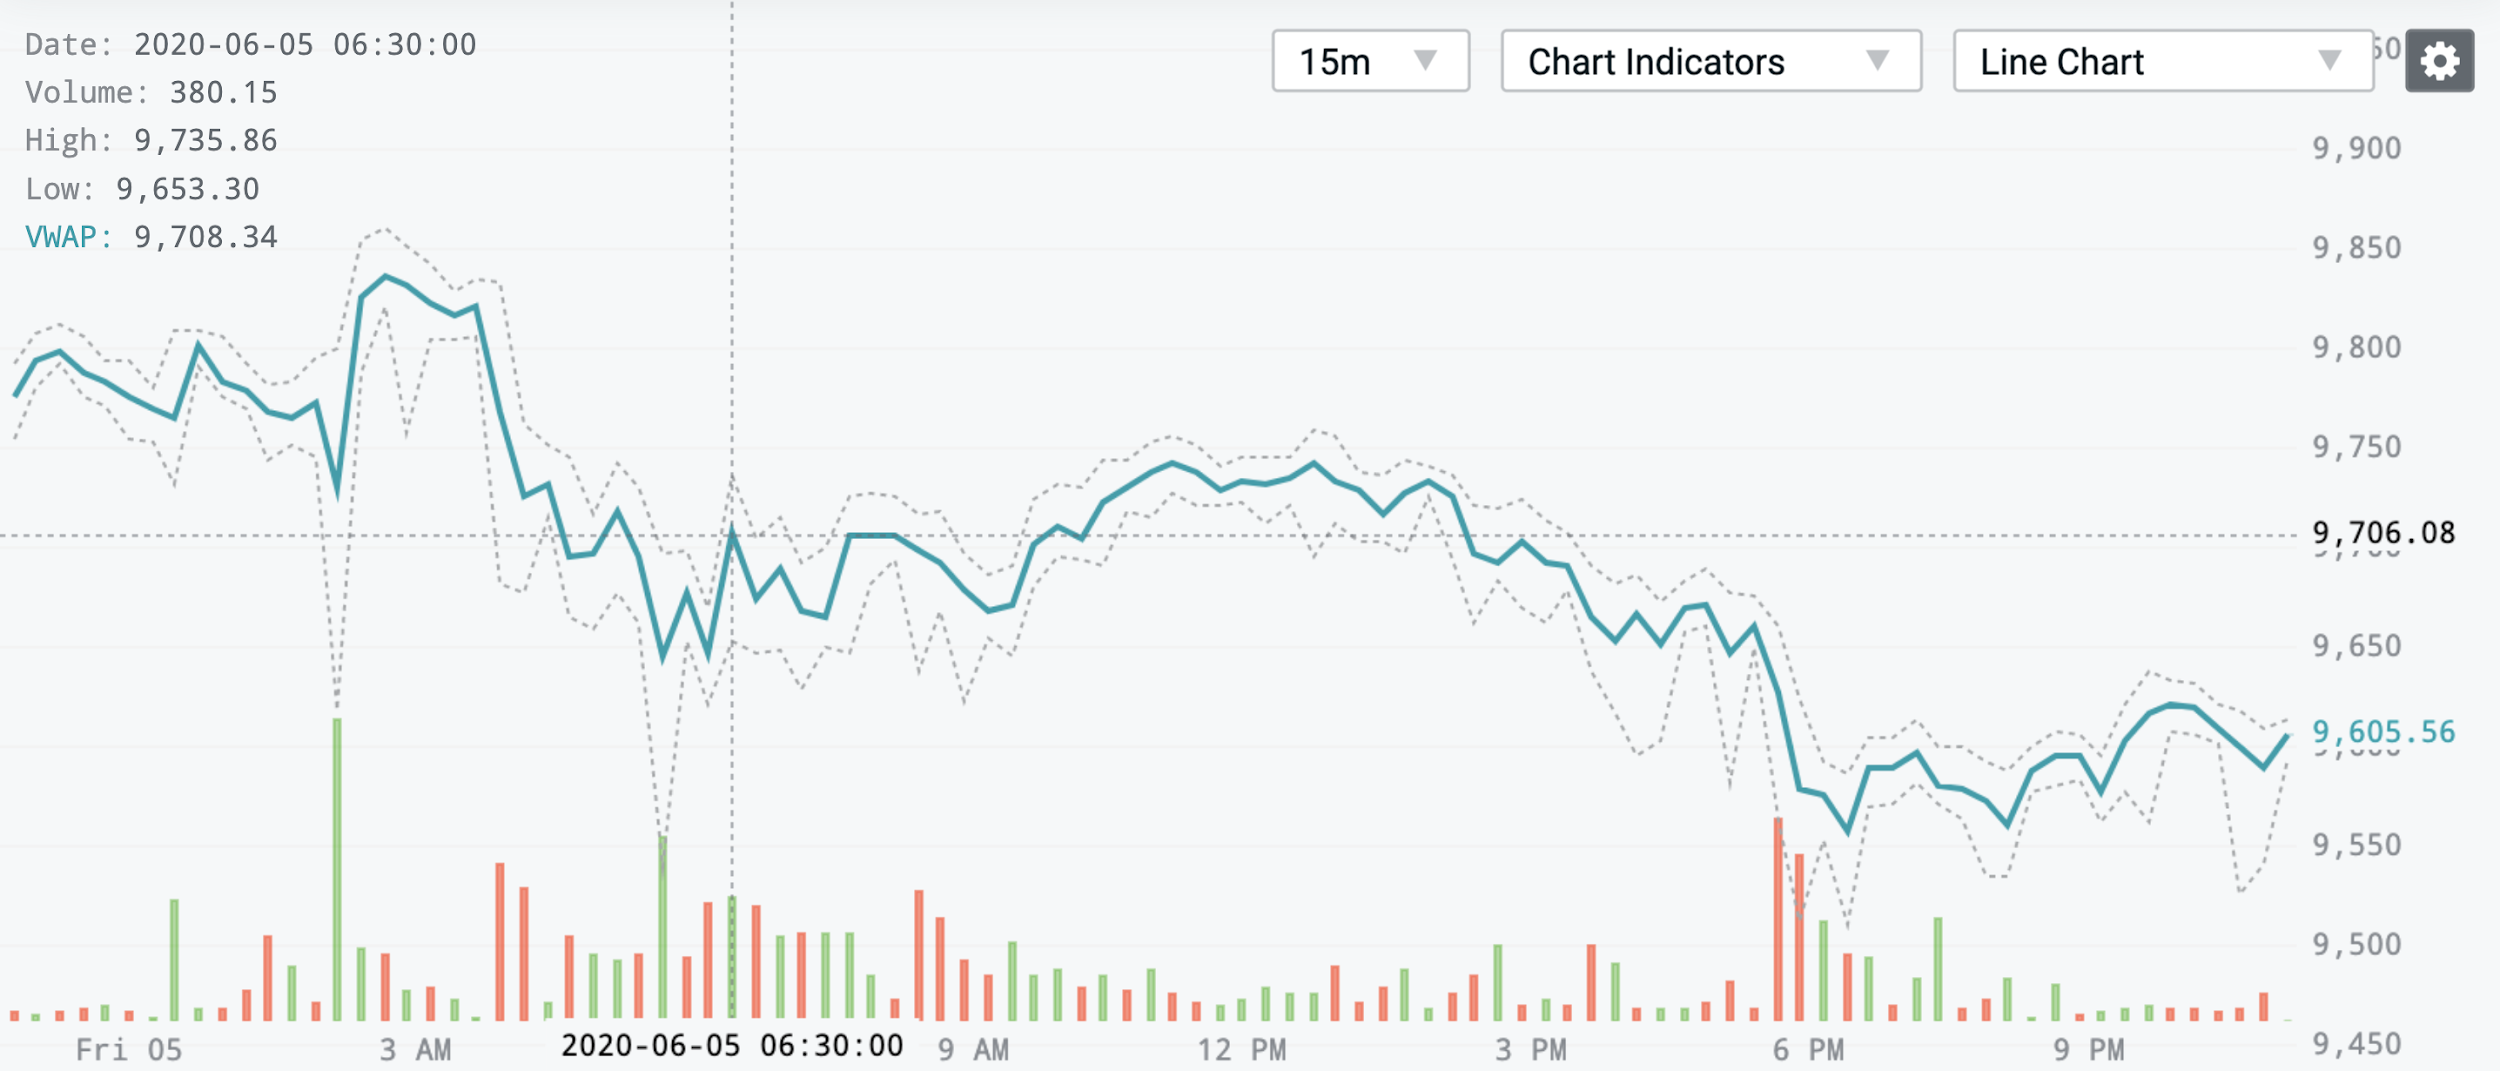
A positive (but controversial) May U.S. jobs report preceded a rise in stocks and a dip in BTC (June 5th).
The B.L.S. reported that the national U.S. unemployment rate decreased 1.4 percentage points to 13.3% in May, with total nonfarm payroll employment increasing by 2.5 million. Although there has been some controversy regarding how the peculiarities of COVID-19 may have impacted the report, these figures were largely viewed as better than expected. The S&P 500 rose 0.93% on June 5th, the day of the report; that same day, the price of bitcoin fell 3.54% from a high of $9860.33 to a low of $9511.00.
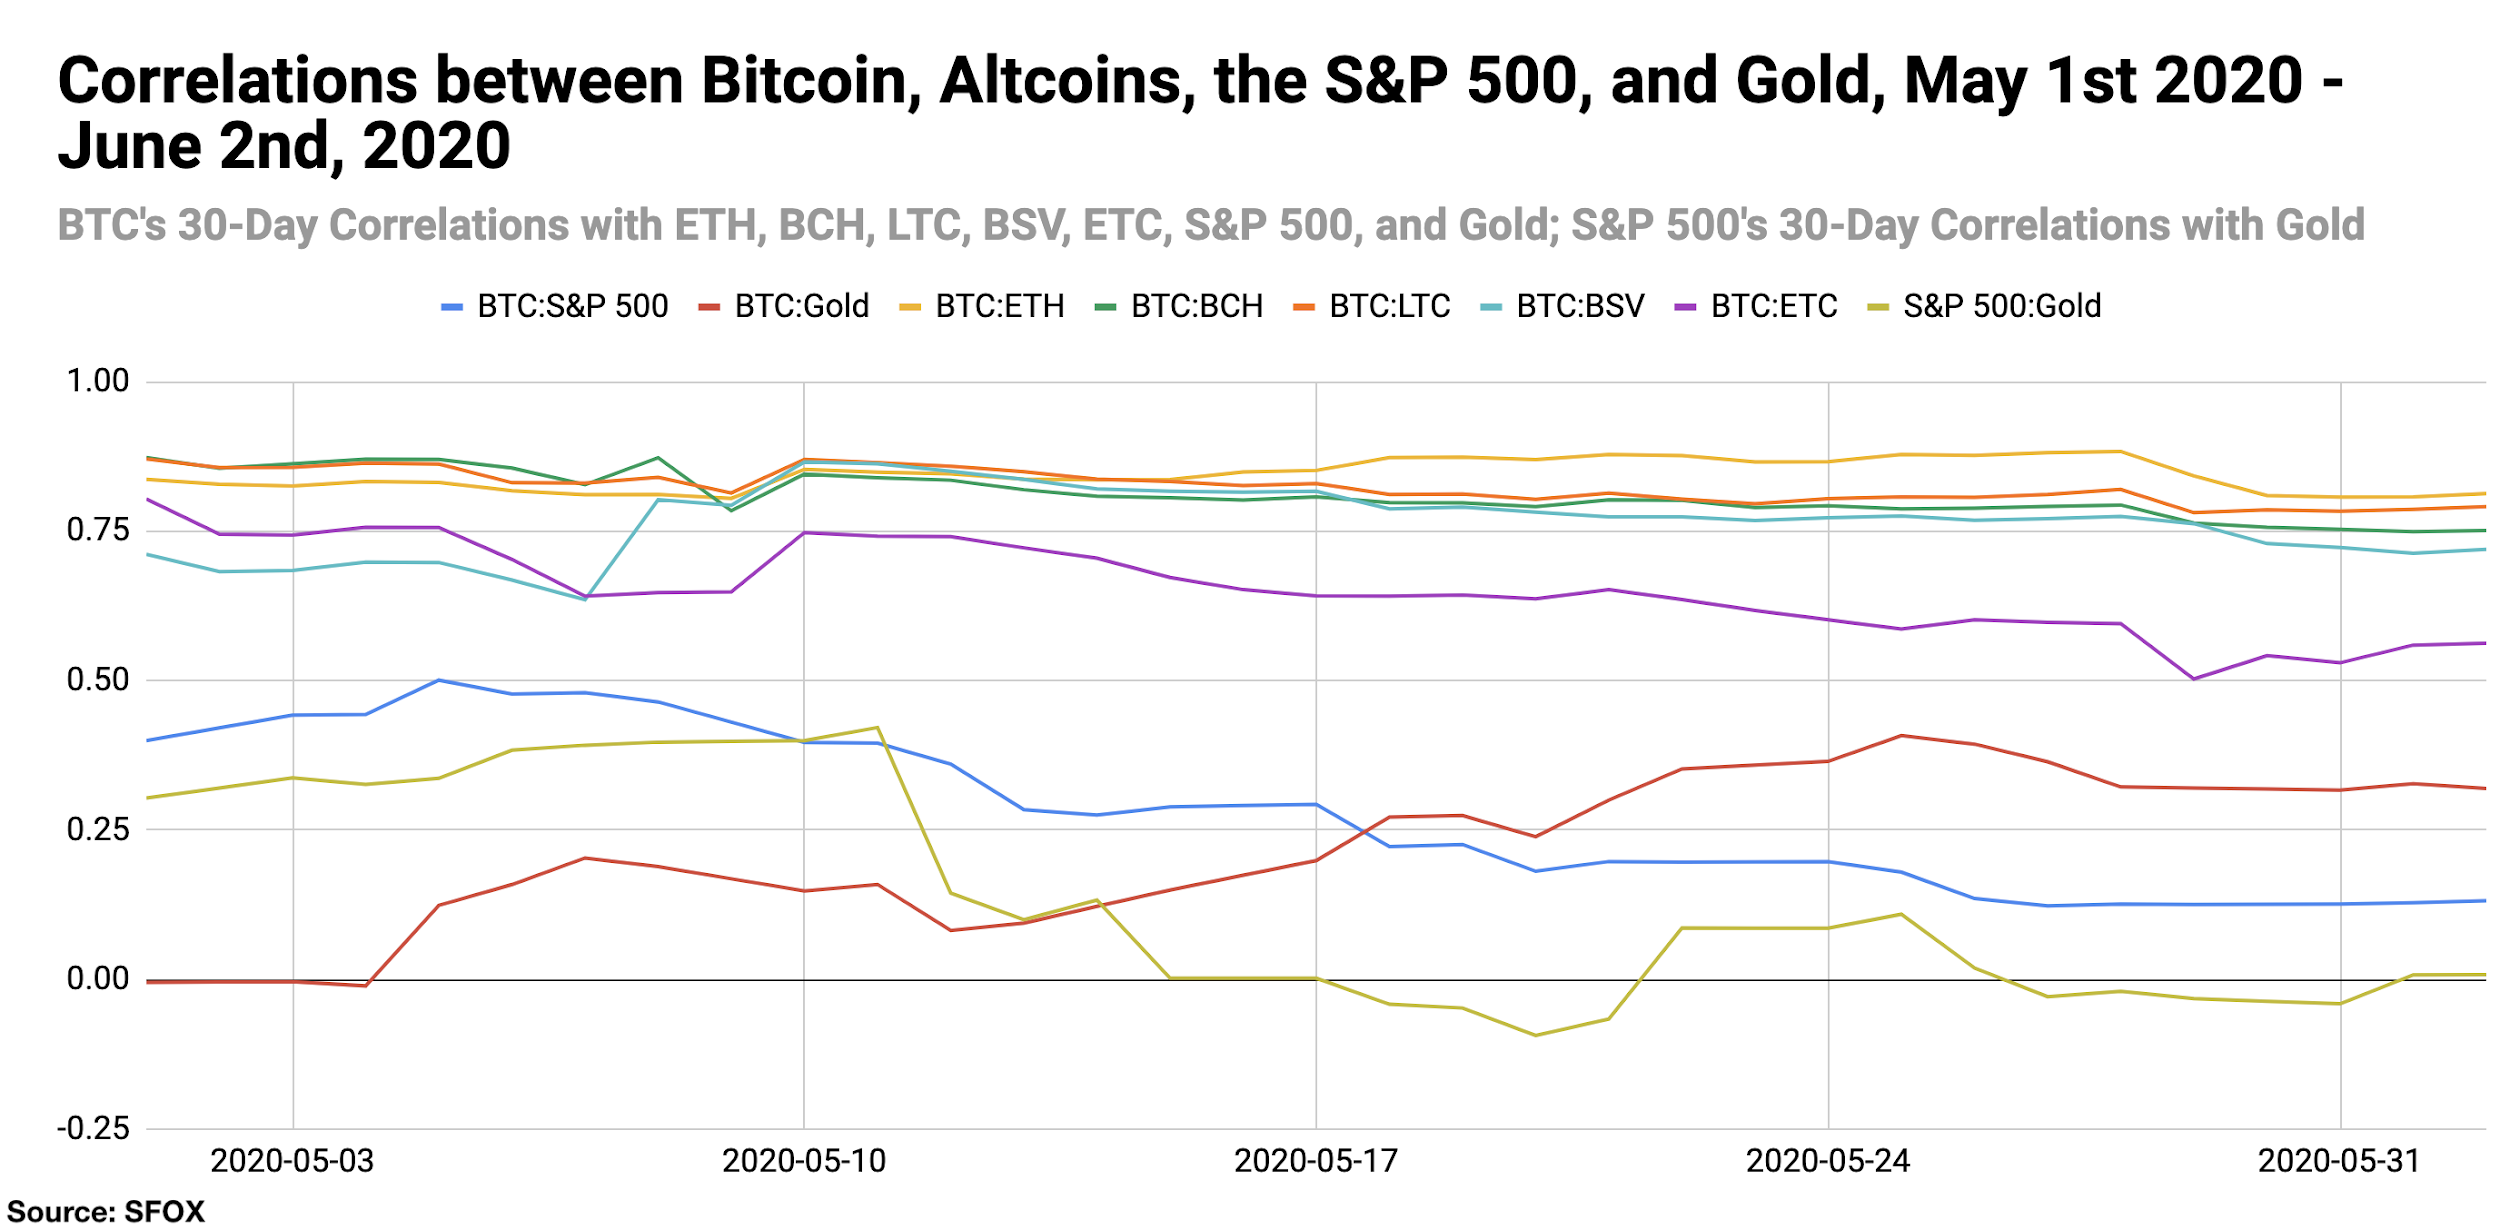
Though it may be tempting to infer that the movements of both the S&P 500 and bitcoin were caused by the jobs report, it’s important to remember that bitcoin is, in theory, uncorrelated to equities in the long-run. In fact, SFOX research shows that the average 30-day BTC:S&P500 correlation over the last 16 months (ending May 26th) has been virtually 0 (-0.0061). Even if the initial pandemic environment led to atypical positive correlations between crypto and the S&P 500, that’s not a reason to believe that every BTC & stock movement has a common explanation—for instance, BTC’s movement could theoretically be a mere technical loss of momentum rather than a reaction to U.S. job news.
Crypto exchanges continue to experience unexpected outages (May 19th; June 2nd).
Consistent with the last few months, large crypto exchanges have experienced significant downtime in the last several weeks. On May 19th, BitMEX saw its trading engine go offline for about an hour; on June 2nd, Coinbase went offline unexpectedly, leaving its traders unable to access the crypto market as the price of BTC briefly climbed above the $10,000 mark as high as $10,430 before receding the following day. With this being the third month in a row that exchange outages have made headlines, market participants may wish to consider asking what safeguards, if any, their exchange of choice has in place to ensure they’re not locked out of the market when BTC moves. (SFOX, which gives traders access to 20 different trading venues from a single account and order book, remains up and running even in the event that one or several exchanges experience downtime.)
Ethereum showed the largest month-over-month returns as of June 2nd, potentially reflecting the recovery of DeFi’s market cap and preparation by market participants for Ethereum 2.0 (June 2nd).
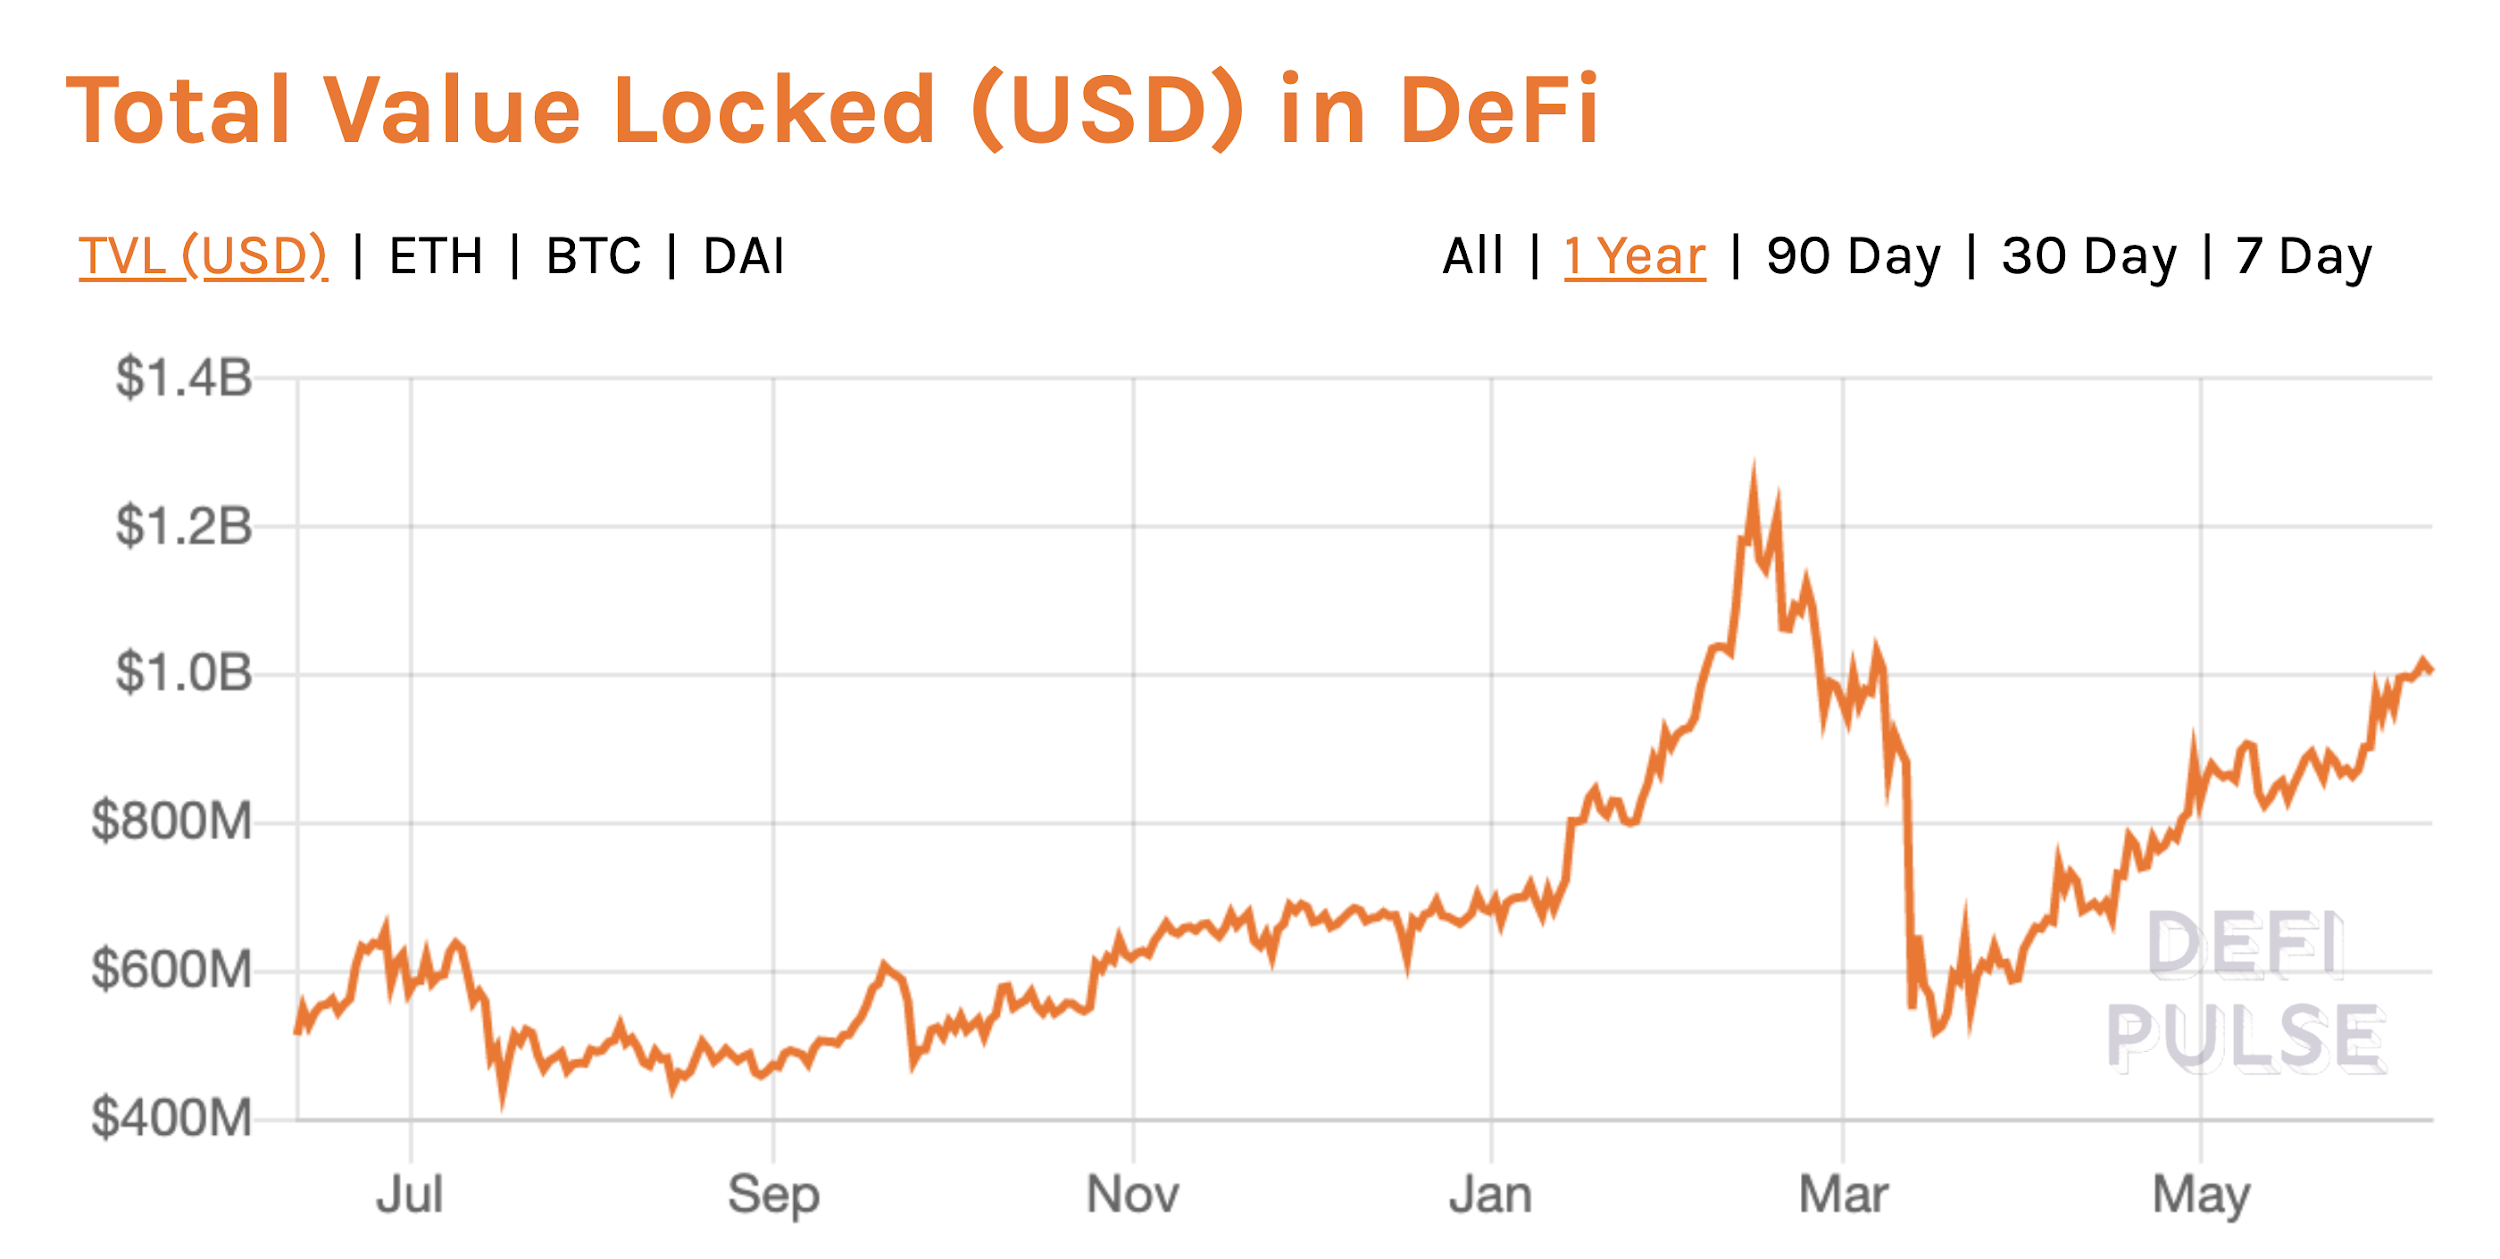
For the second month in a row, ETH has shown the highest month-over-month returns of any major cryptocurrency (16.15%). There are two key factors that may potentially be contributing to this sustained increase in the price of ETH. First, the market cap of decentralized finance (“DeFi”), which fell sharply at the outset of the COVID-19 pandemic, has almost recovered to its pre-COVID peak, surpassing $1 billion for the second time ever on June 6th, according to data from DeFi Pulse. Because these applications require ETH to be “locked into” them, thereby removed from circulation, in order for those applications to function, the growth of DeFi could potentially contribute to the price of ETH increasing.
The second factor to keep in mind regarding the increase in ETH’s price is the anticipated move of Ethereum to a proof-of-stake consensus mechanism in Ethereum 2.0. The proof-of-stake mechanism will allow wallets with a minimum of 32 ETH to run a staking node and participate in validating the Ethereum blockchain. It’s noteworthy, therefore, that the number of wallets holding a minimum of 32 ETH has steadily increased, according to research from Nansen and Arcane Research.
👀Another sneak peek into our weekly market report👀
Are investors getting ready for Ethereum staking? Data from @nansen_ai shows that almost 120,000 @ethereum wallets are ready for staking. This number has grown by 13% over the past year.
Read more here: https://t.co/UKFQKI2jze pic.twitter.com/G3nXhylels— K33 Research (@K33Research) June 8, 2020
To the extent that the price of ETH may be influenced by anticipation of Ethereum 2.0, this may also point to a sizable amount of uncertainty in ETH markets because it’s not clear precisely when Ethereum 2.0 and staking will actually launch. Ethereum 2.0 client developer Ben Edgington stated that the staking system for Ethereum 2.0 could be live as early as July 2020, but the exact timeline to launch remains unclear.
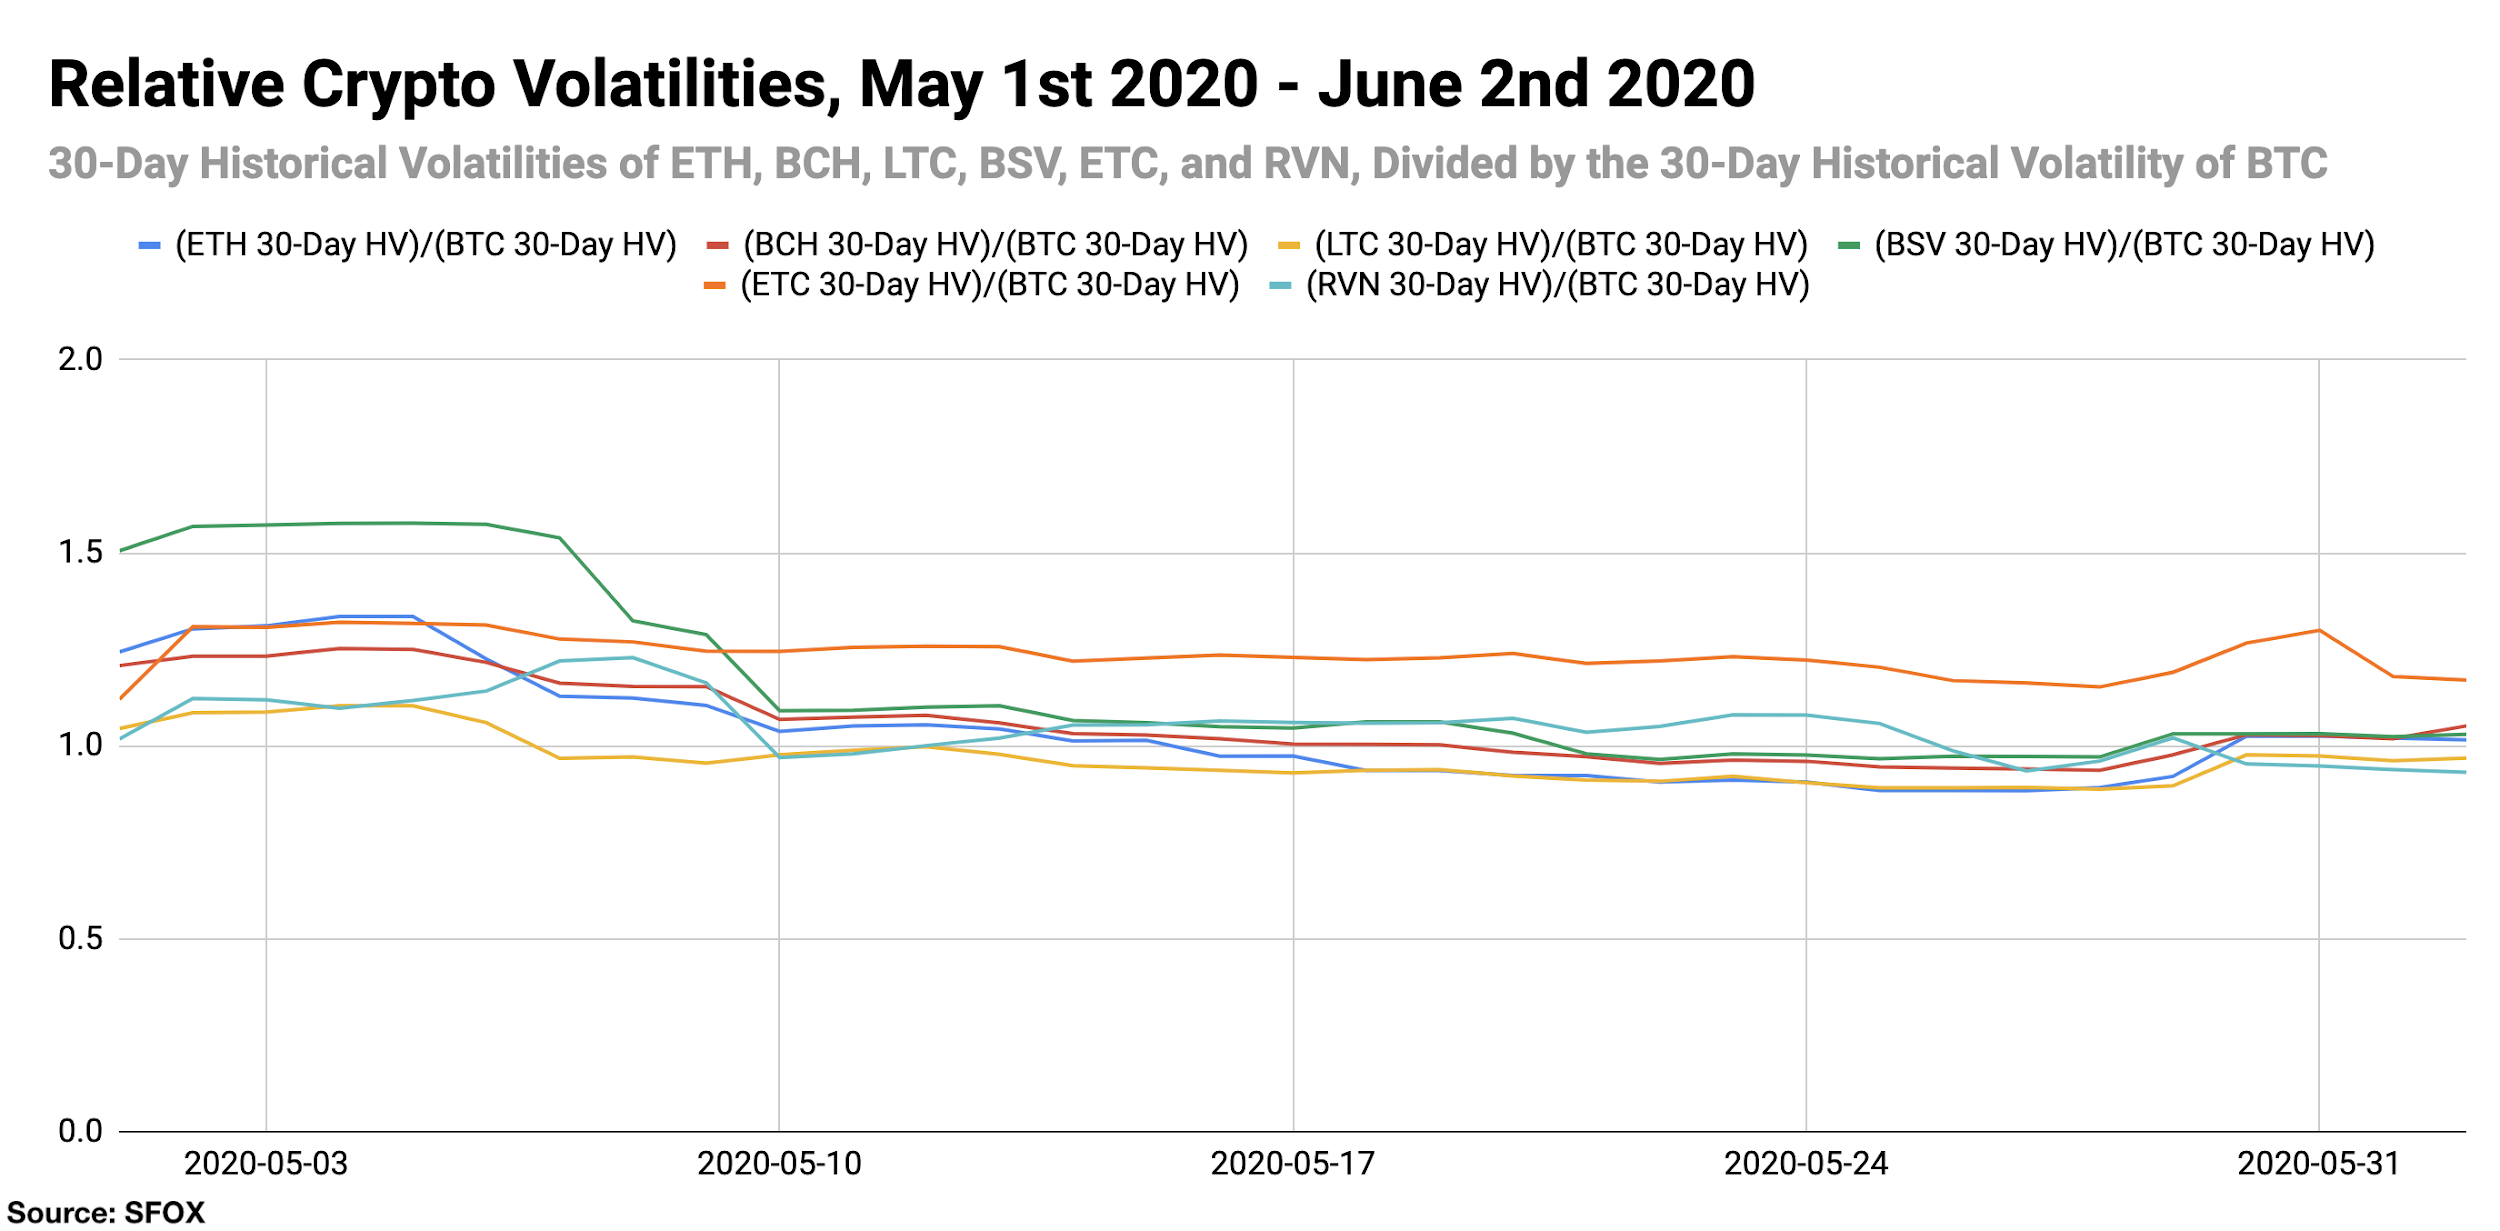
The volatility levels of leading cryptocurrencies have become much more homogeneous.
Historically, the volatility levels of major cryptocurrencies have had a wide range: as recently as the beginning of April 2020, there was a difference of 102 percentage points between the 30-day historical volatilities of the most volatile SFOX-enabled cryptocurrency (BSV) and the least volatile SFOX-enabled cryptocurrency (RVN). As of June 2nd, that difference had tightened to a 14-percentage-point difference between ETC (70.66% 30-day historical volatility) and RVN (56.23% 30-day historical volatility).

What’s more, the ratio of altcoin volatility to bitcoin volatility is nearing 1 for all major altcoins available for trading on SFOX, meaning that the volatility of altcoins is generally coming closer to equalling the volatility of bitcoin.

This time horizon isn’t sufficiently long to draw any firm conclusions about the state of volatility in the crypto sector, but it’s possible, theoretically, that the volatility of more established cryptocurrencies could become more uniform as the sector continues to mature. If this ends up being a continued trend in the coming months, it could theoretically serve as a motivating factor for market participants to look at smaller-market-cap or less developed cryptocurrencies, and/or crypto derivatives, as higher-volatility products.
Products
J.P. Morgan is showing further support of the crypto sector, indicating a further bridging of the divide between crypto and traditional finance (May 12th; May 22nd).
J.P. Morgan made headlines throughout the last month for actions further endorsing the legitimacy of the crypto sector. On May 12th, it was reported that they had signed crypto exchanges Coinbase and Gemini as clients; on May 22nd, author Jeff Roberts claimed that J.P. Morgan CEO Jamie Dimon had “secret meetings” with Coinbase CEO Brian Armstrong as early as 2018. Compounded with J.P. Morgan’s development of their own internal cryptocurrency last year, this may be considered by some market participants to be a signal of further acceptance by traditional finance of new, crypto-based financial offerings.
Regulatory
The Russian State Duma is circulating a proposed law that would further restrict cryptocurrency business within the country (June 1st).
The latest version of the proposed law would reportedly “prohibit the circulation of all cryptocurrencies, as well as their mining and advertising.” The law would not, however, forbid the ownership of digital financial assets.
The Details: Crypto Price, Volatility, and Correlation Data, May 1st – June 2nd, 2020
Price Performance: Toward Horizontal
The volume-weighted average price of Bitcoin (BTC) began May 2020 at the price of $8803.19 and stayed within a range of $8679.83 and $9922.77 throughout most of the month; at the end of May into June, the price of BTC has tested the $10000 threshold several times (peaking at $10,421.63 on May 31st), but the volume-weighted average price of Bitcoin has stayed in the narrow range of $9511.90 and $9869.54 in the first 9 days of June. 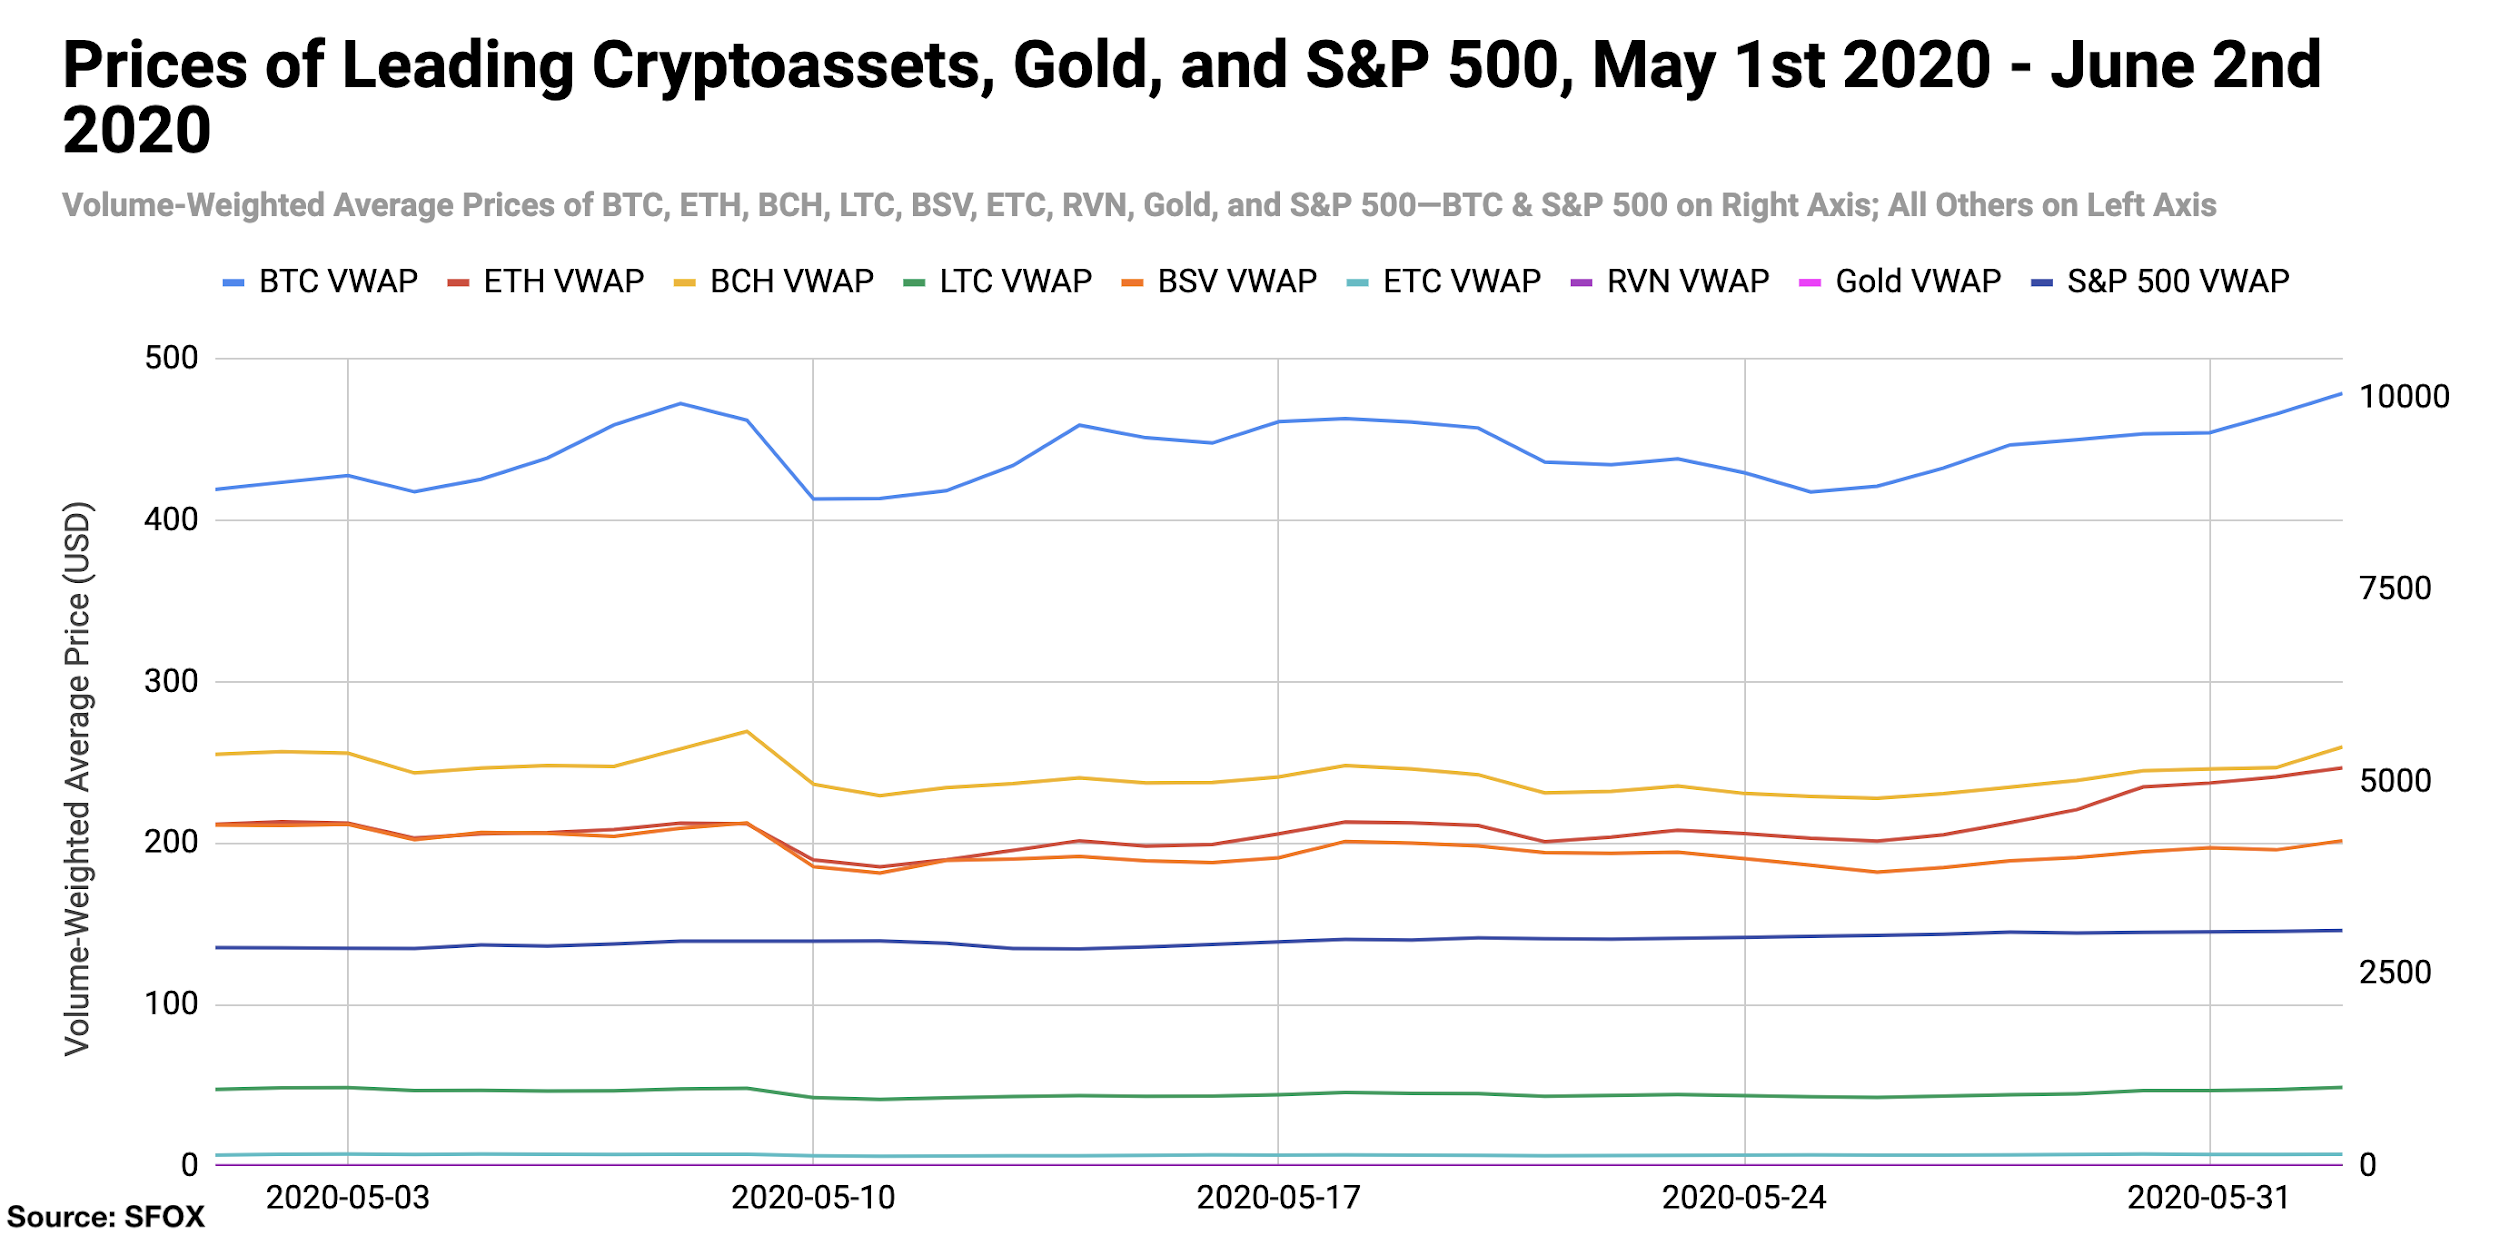
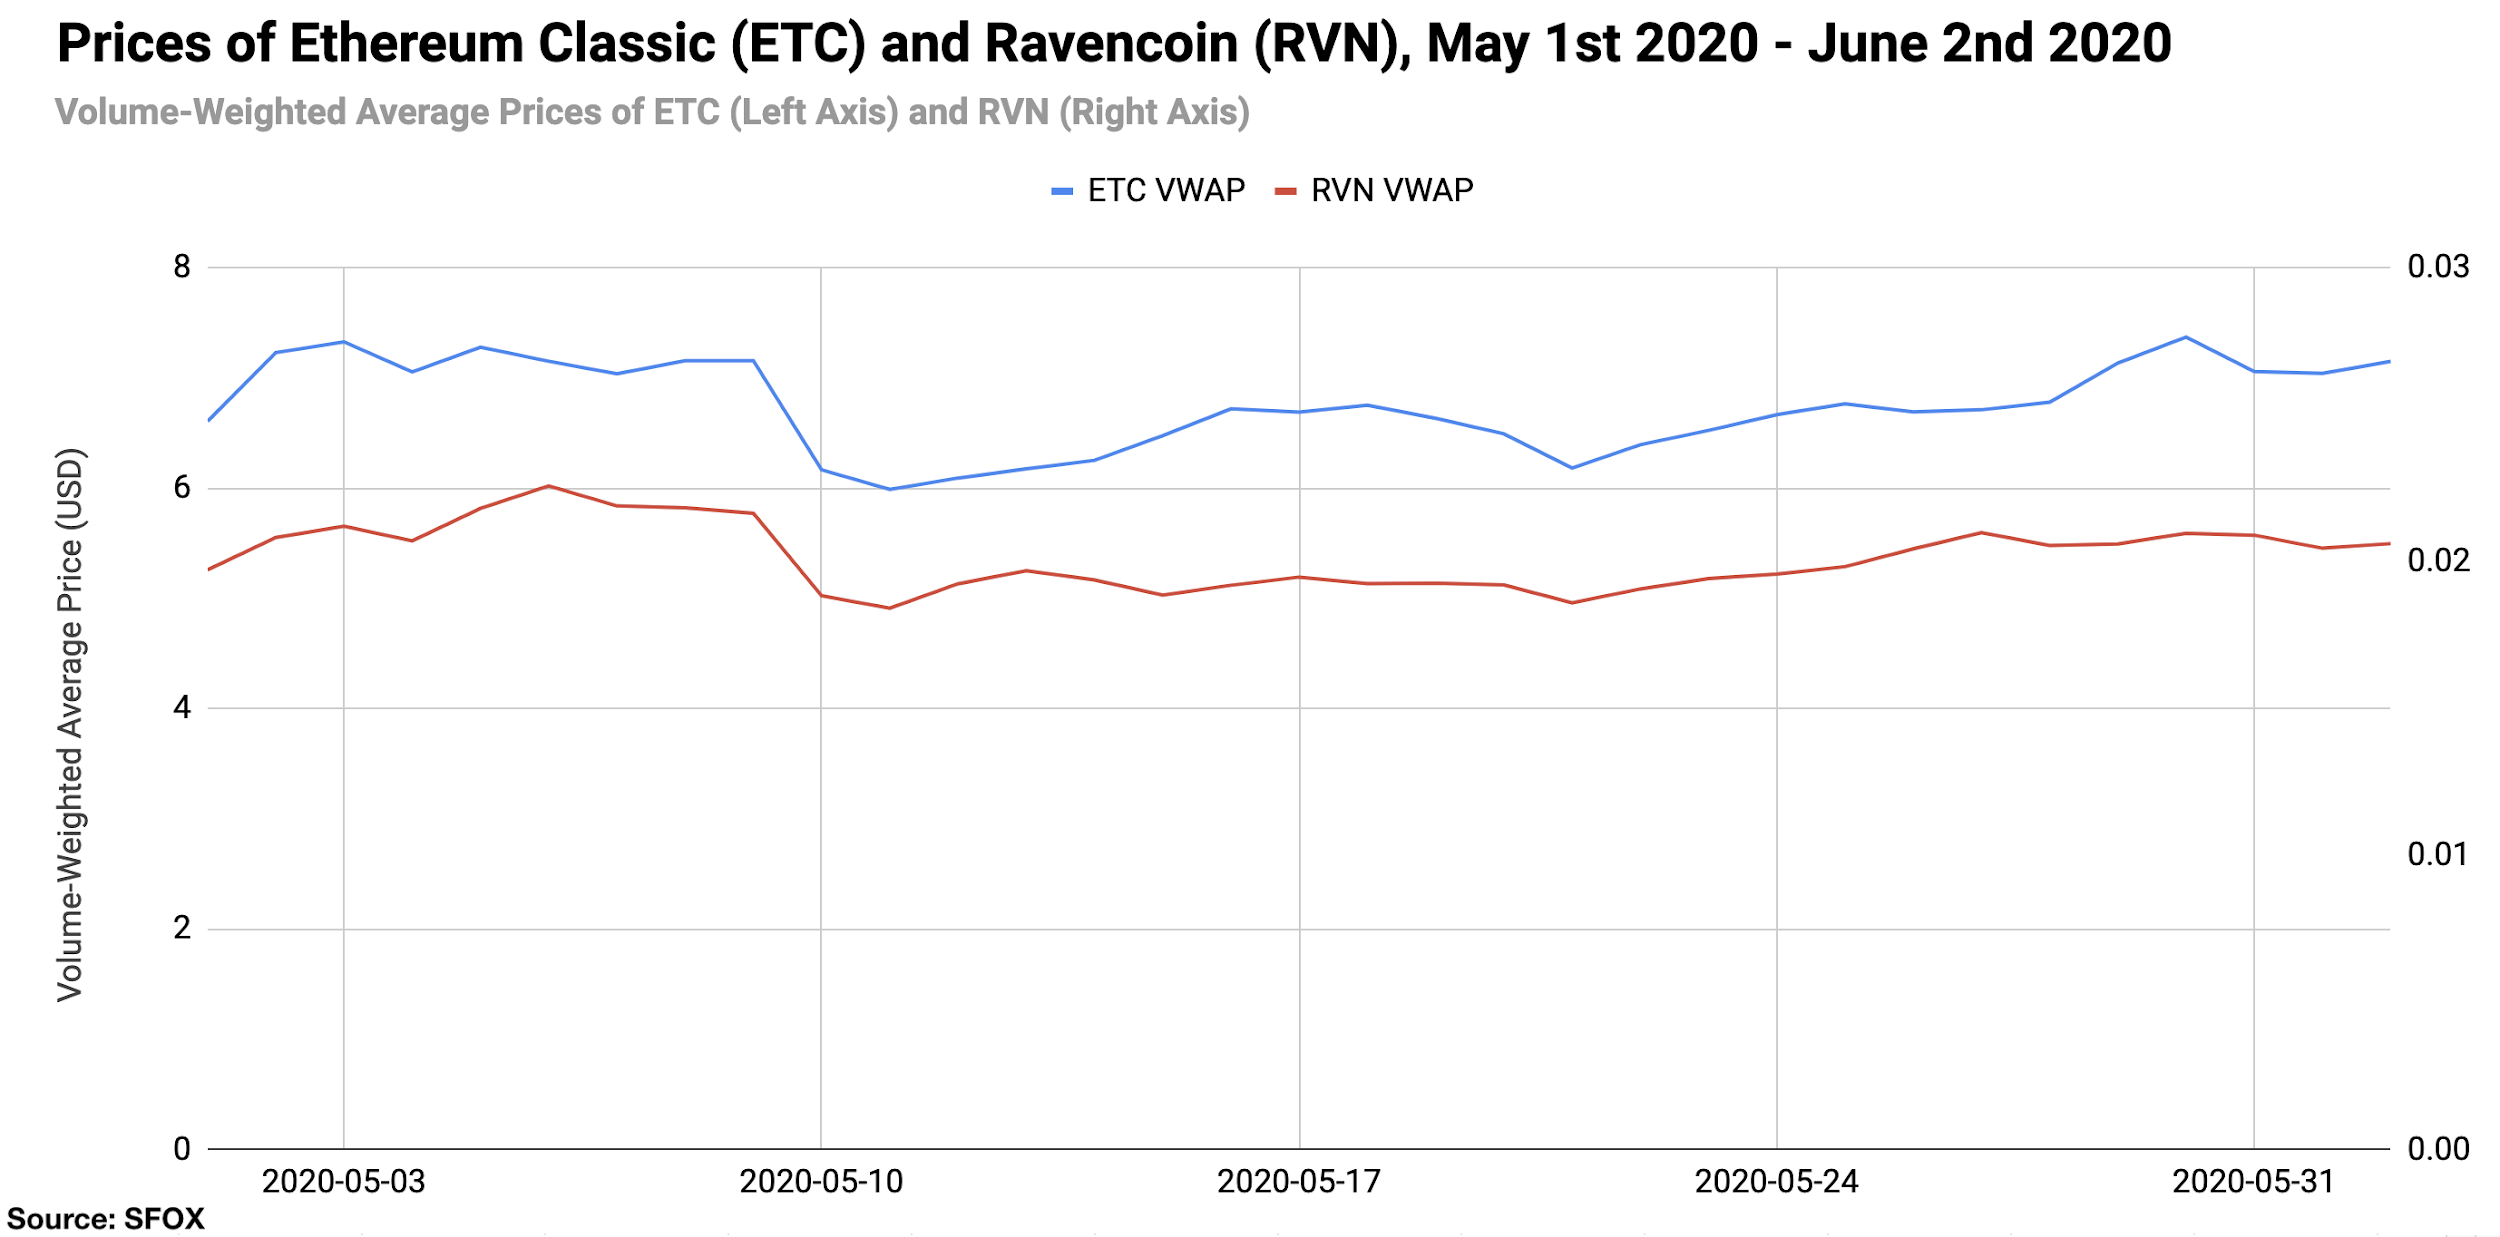
For better visibility of ETC and RVN price movements, please consult the following graph:
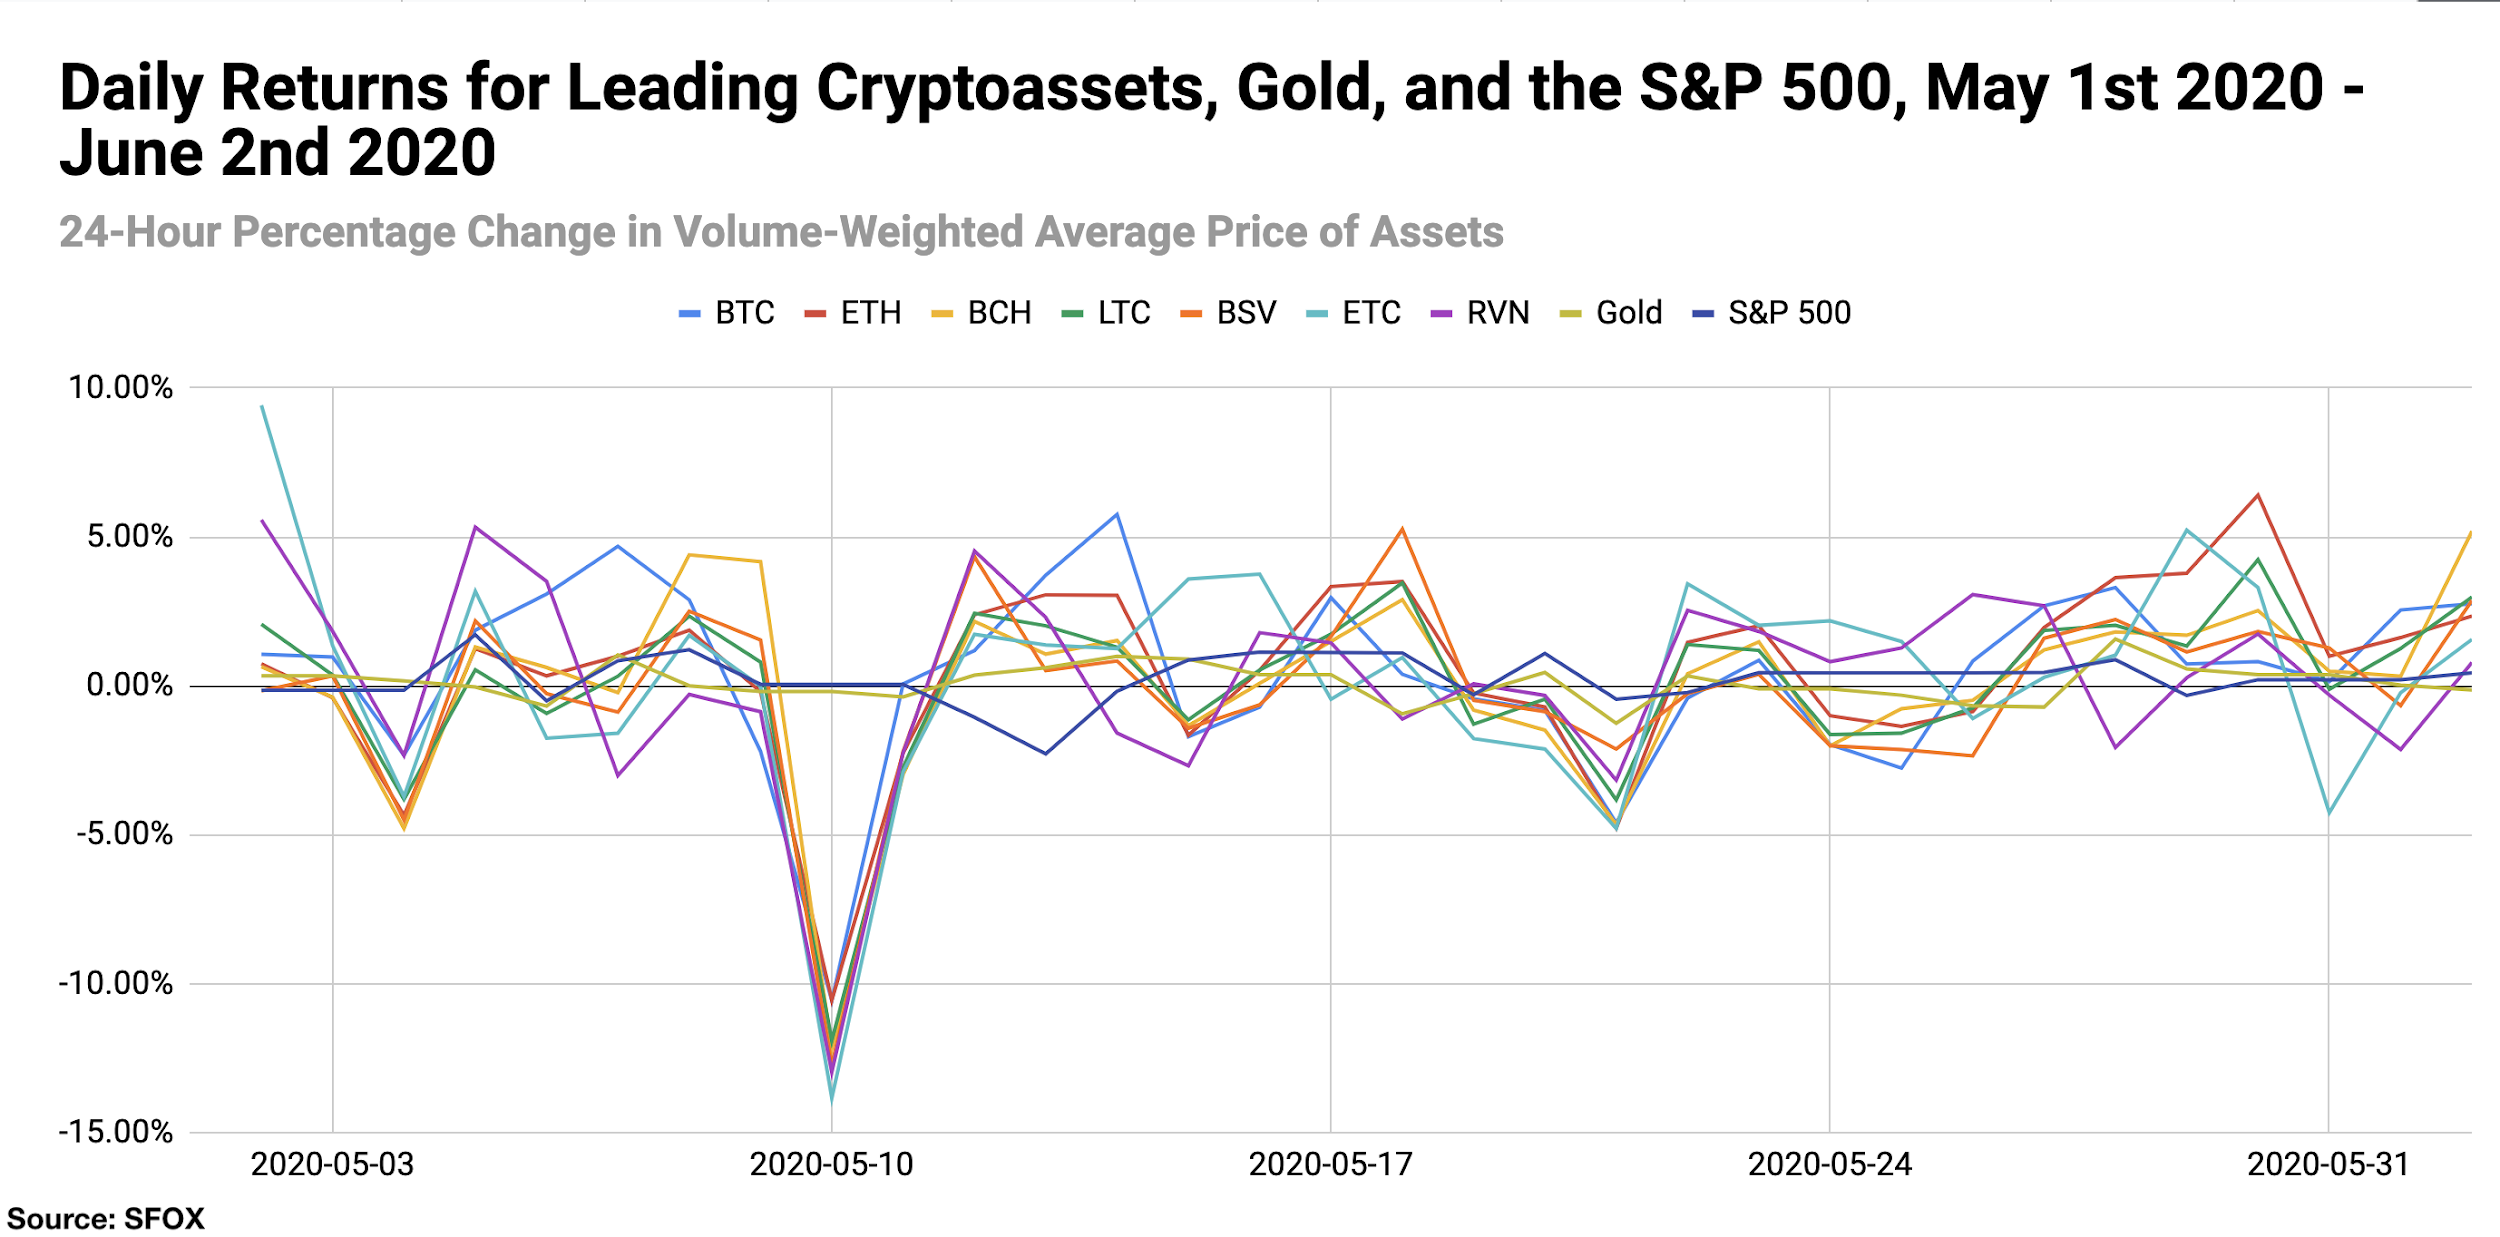
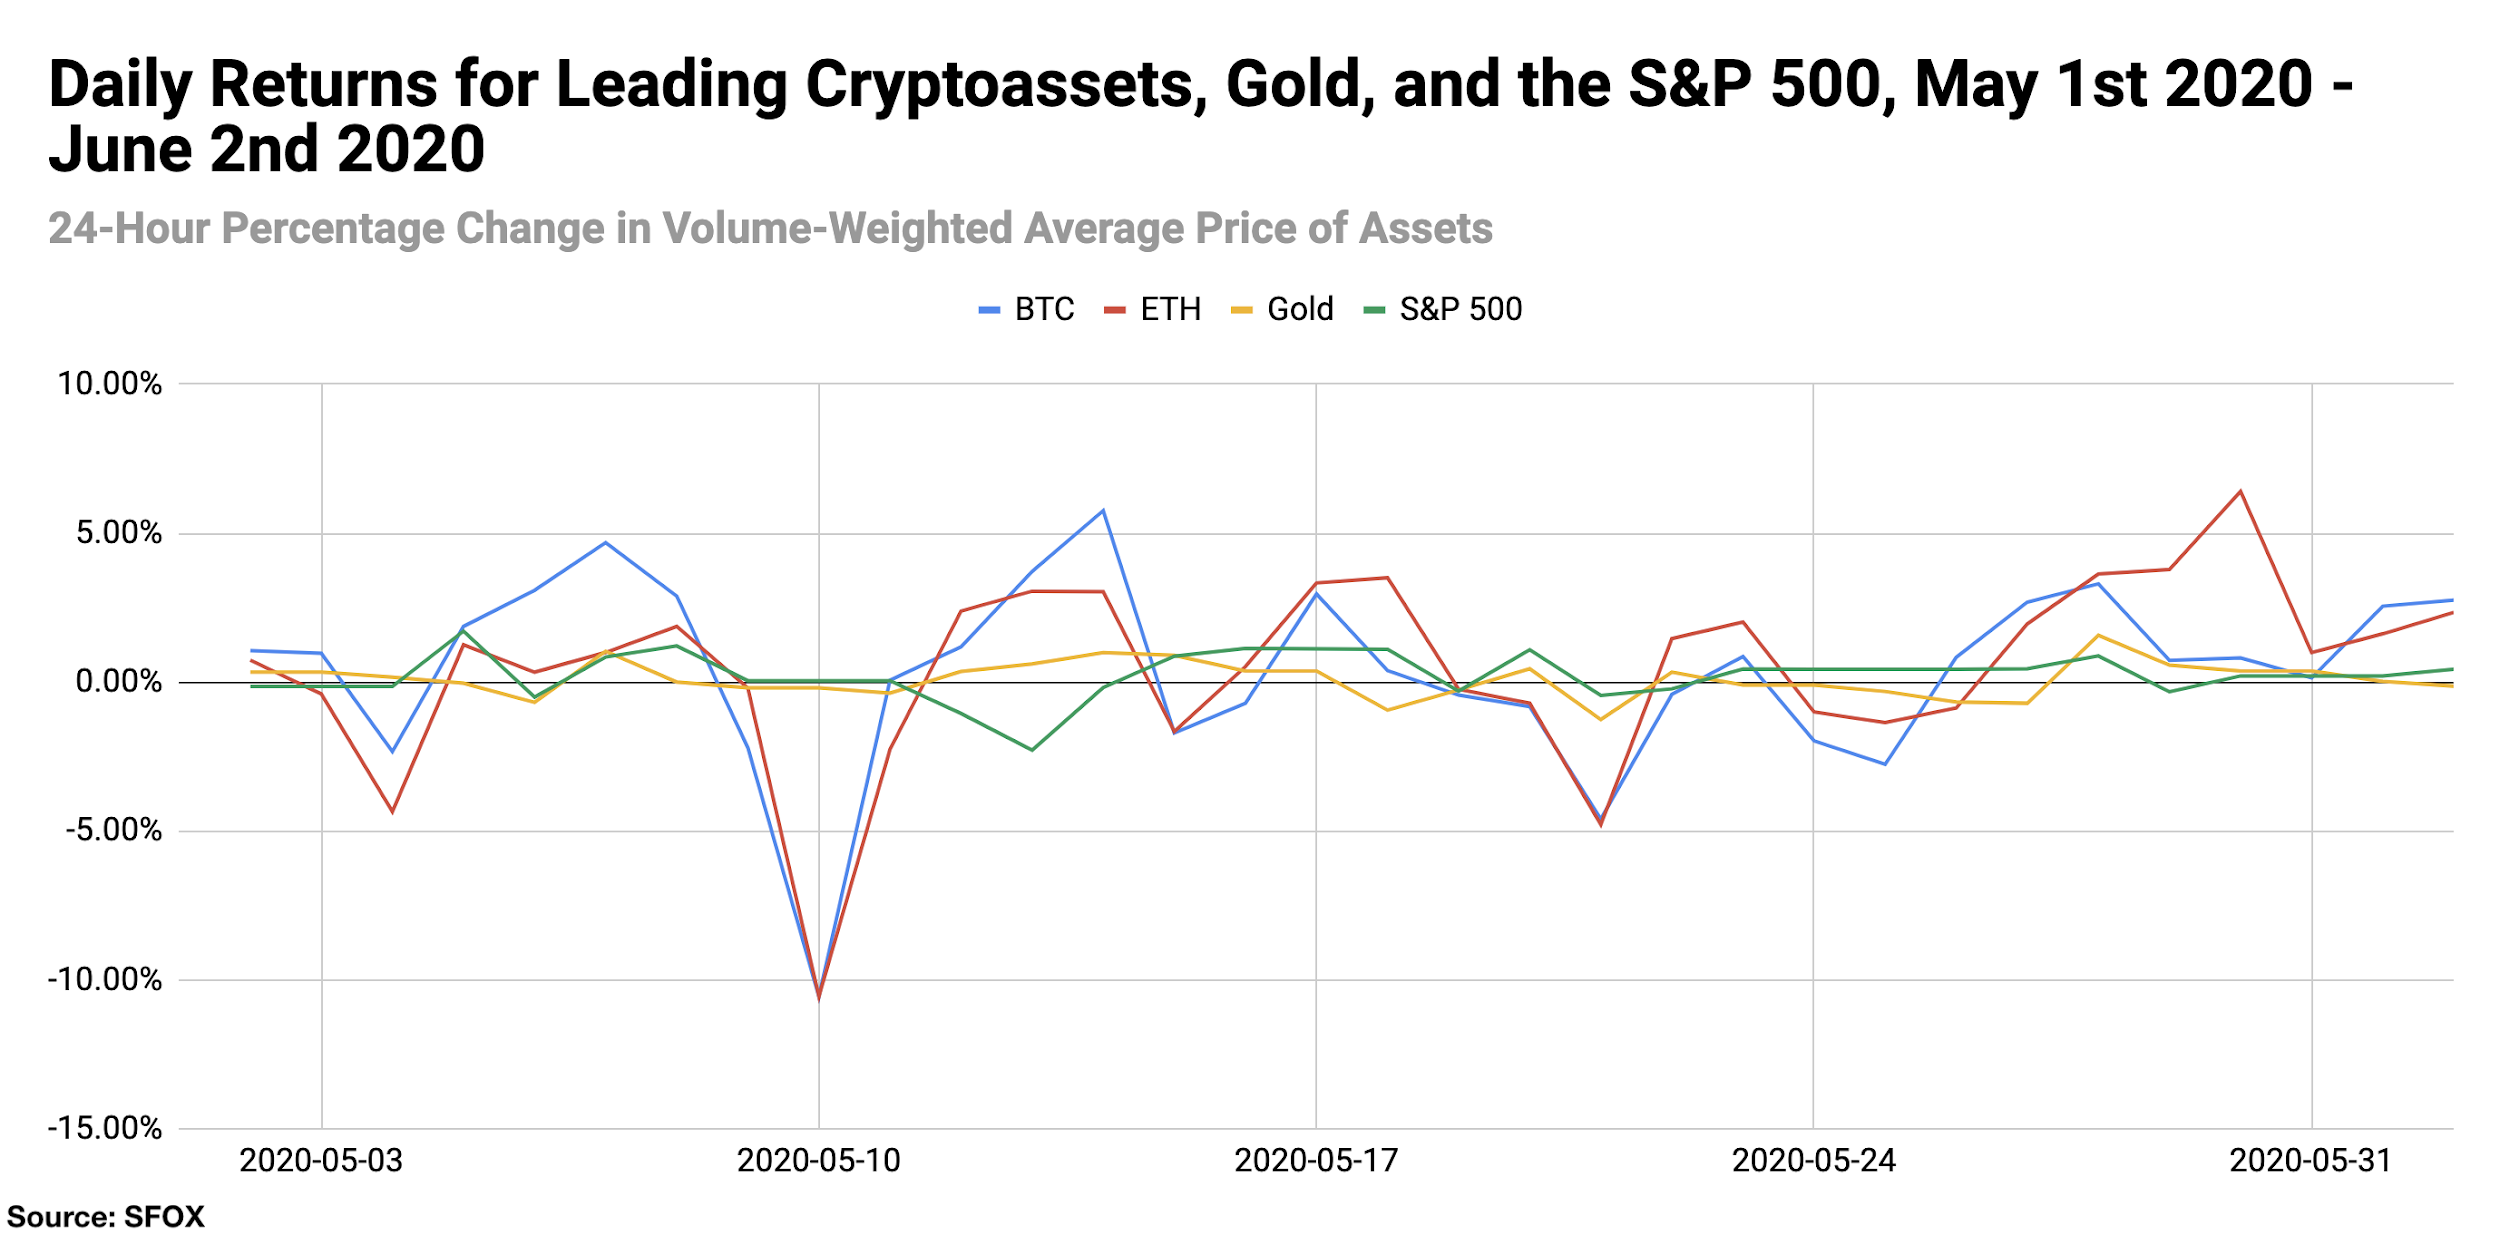
The worst day in the past month for single-day losses across all major cryptocurrencies was May 10th, which saw BTC down 10.56%. ETC saw the largest single-day gain (9.42%) on May 1st; more recently, BTC saw a 5.76% single-day gain on May 14th, and ETH saw a 6.40% gain on May 30th.
For greater graphical clarity, see this additional chart tracking only the daily returns of BTC, ETH, gold, and the S&P 500:
ETH, BTC, BCH, and LTC showed positive month-over-month returns as of June 2nd, along with the S&P 500 and gold. ETC, RVN, and BSV showed month-over-month losses. For the second time in a row, Ether (ETH) stood out with the highest month-over-month returns (16.15%), while BSV showed the greatest losses (4.82%).
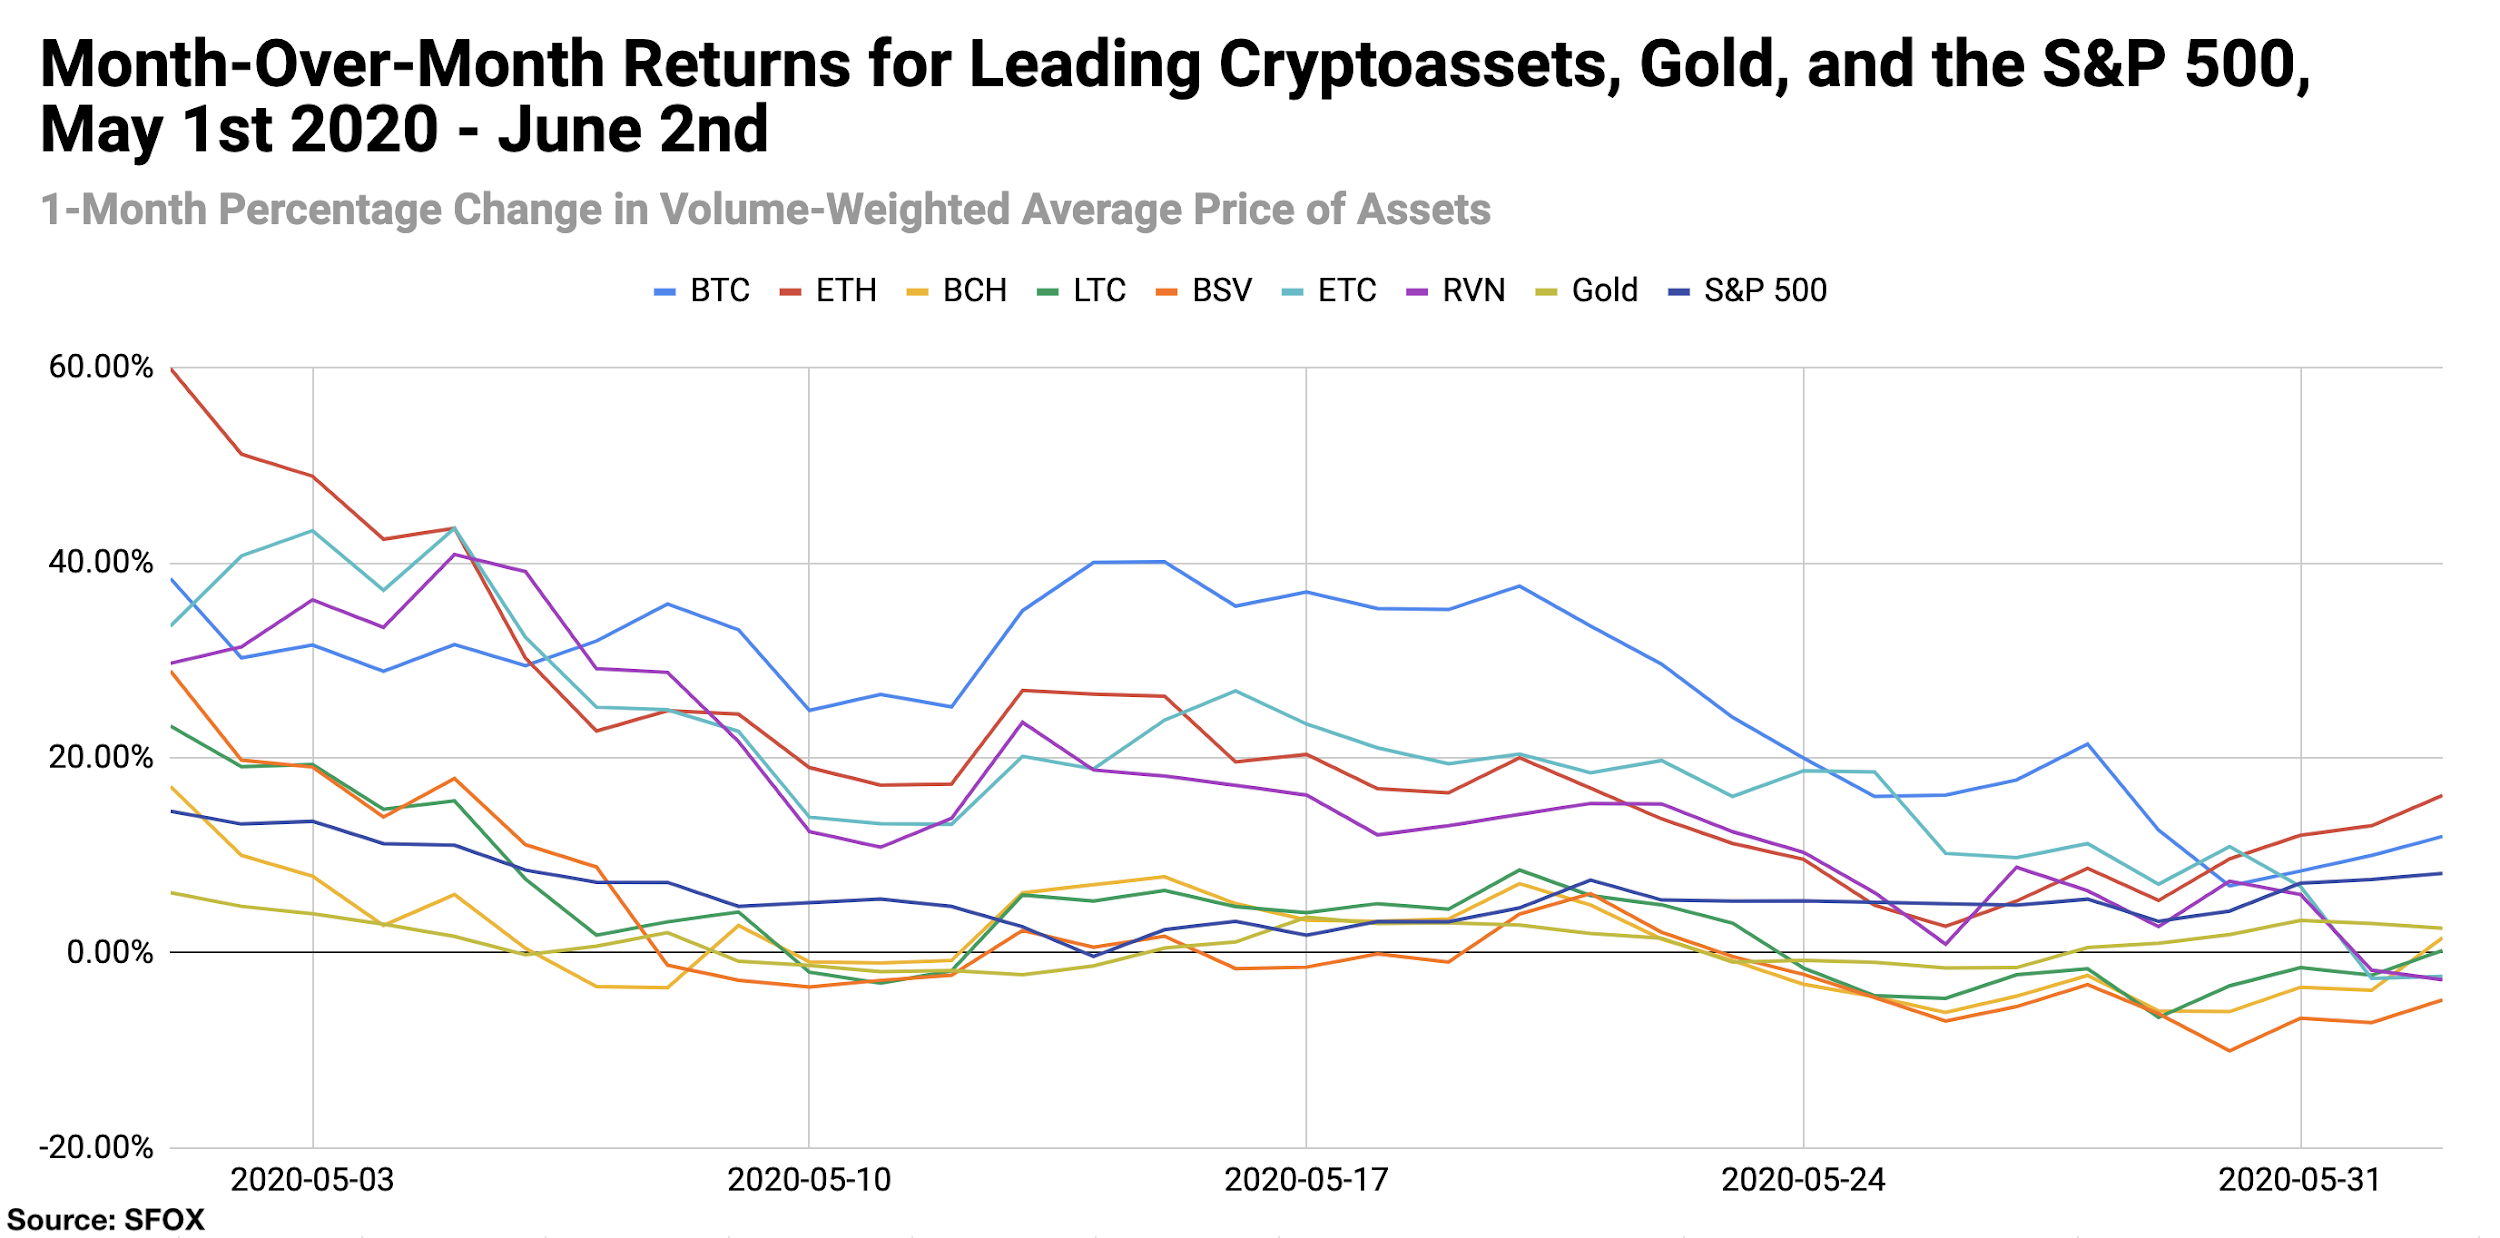
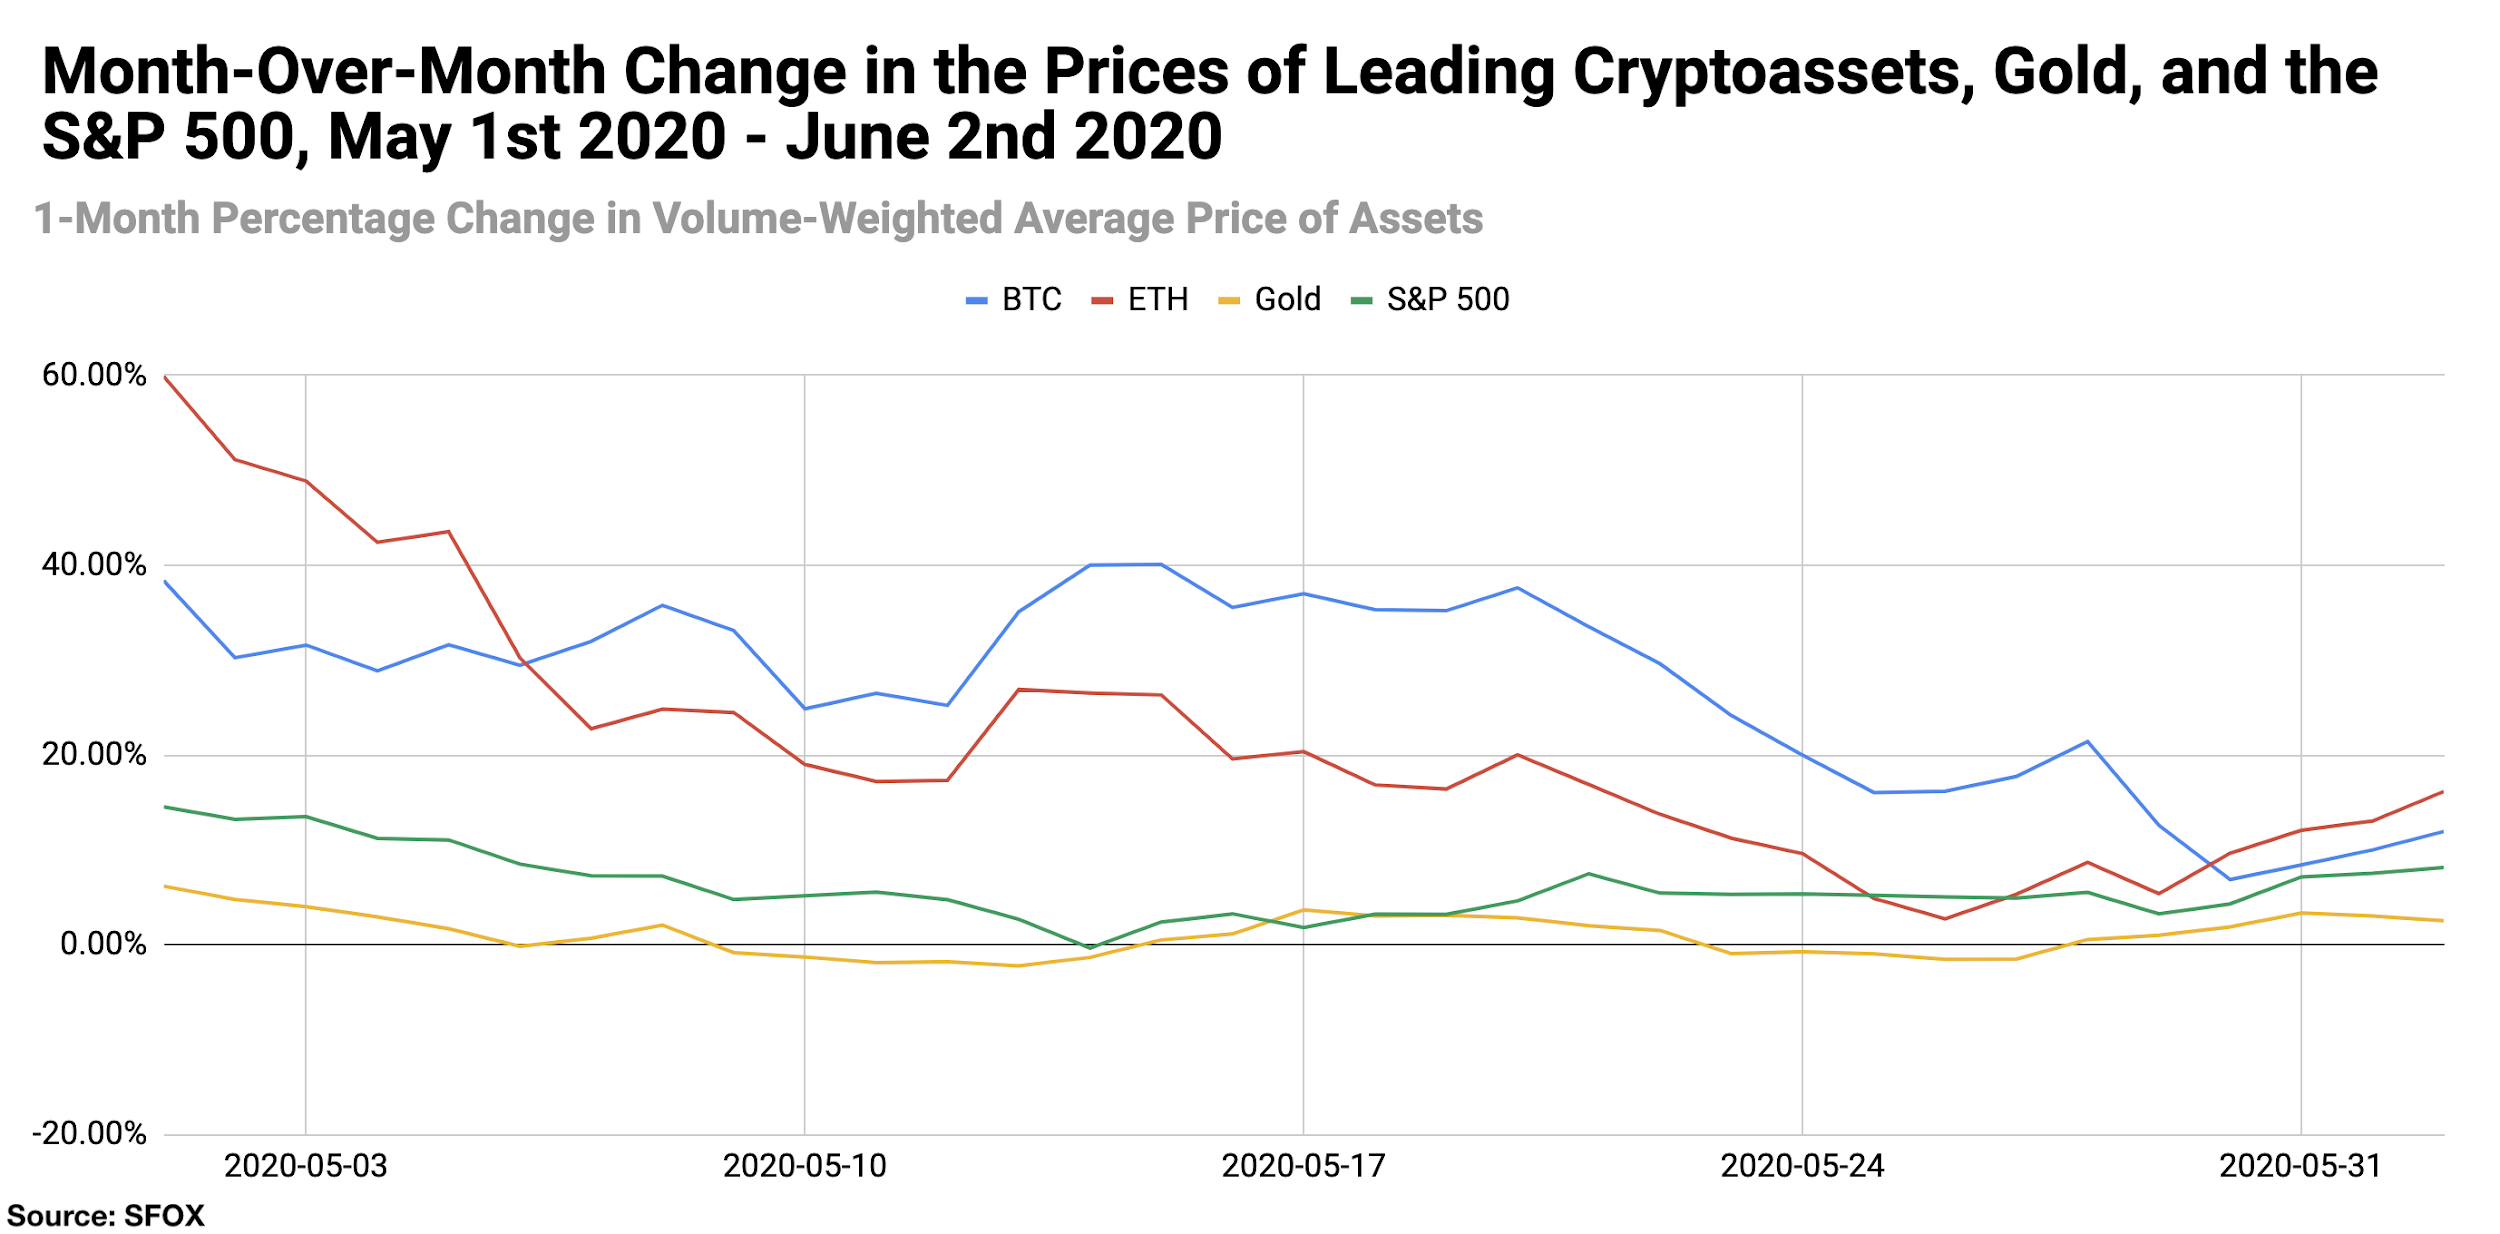
For greater graphical clarity, see this additional chart tracking only the month-over-month changes in the prices of BTC, ETH, gold, and the S&P 500:
Volatility: A Narrower Range
As discussed above, the key insight in terms of crypto volatility this month is that the range of volatilities among leading cryptocurrencies has become unusually narrow. Bitcoin’s volatility has slightly increased in the last month, going from 56.58% on May 1st to 60.37% on June 2nd. The range of crypto volatility values, as of June 2nd, was 14 percentage points, from RVN (56.23%) to ETC (70.66%).
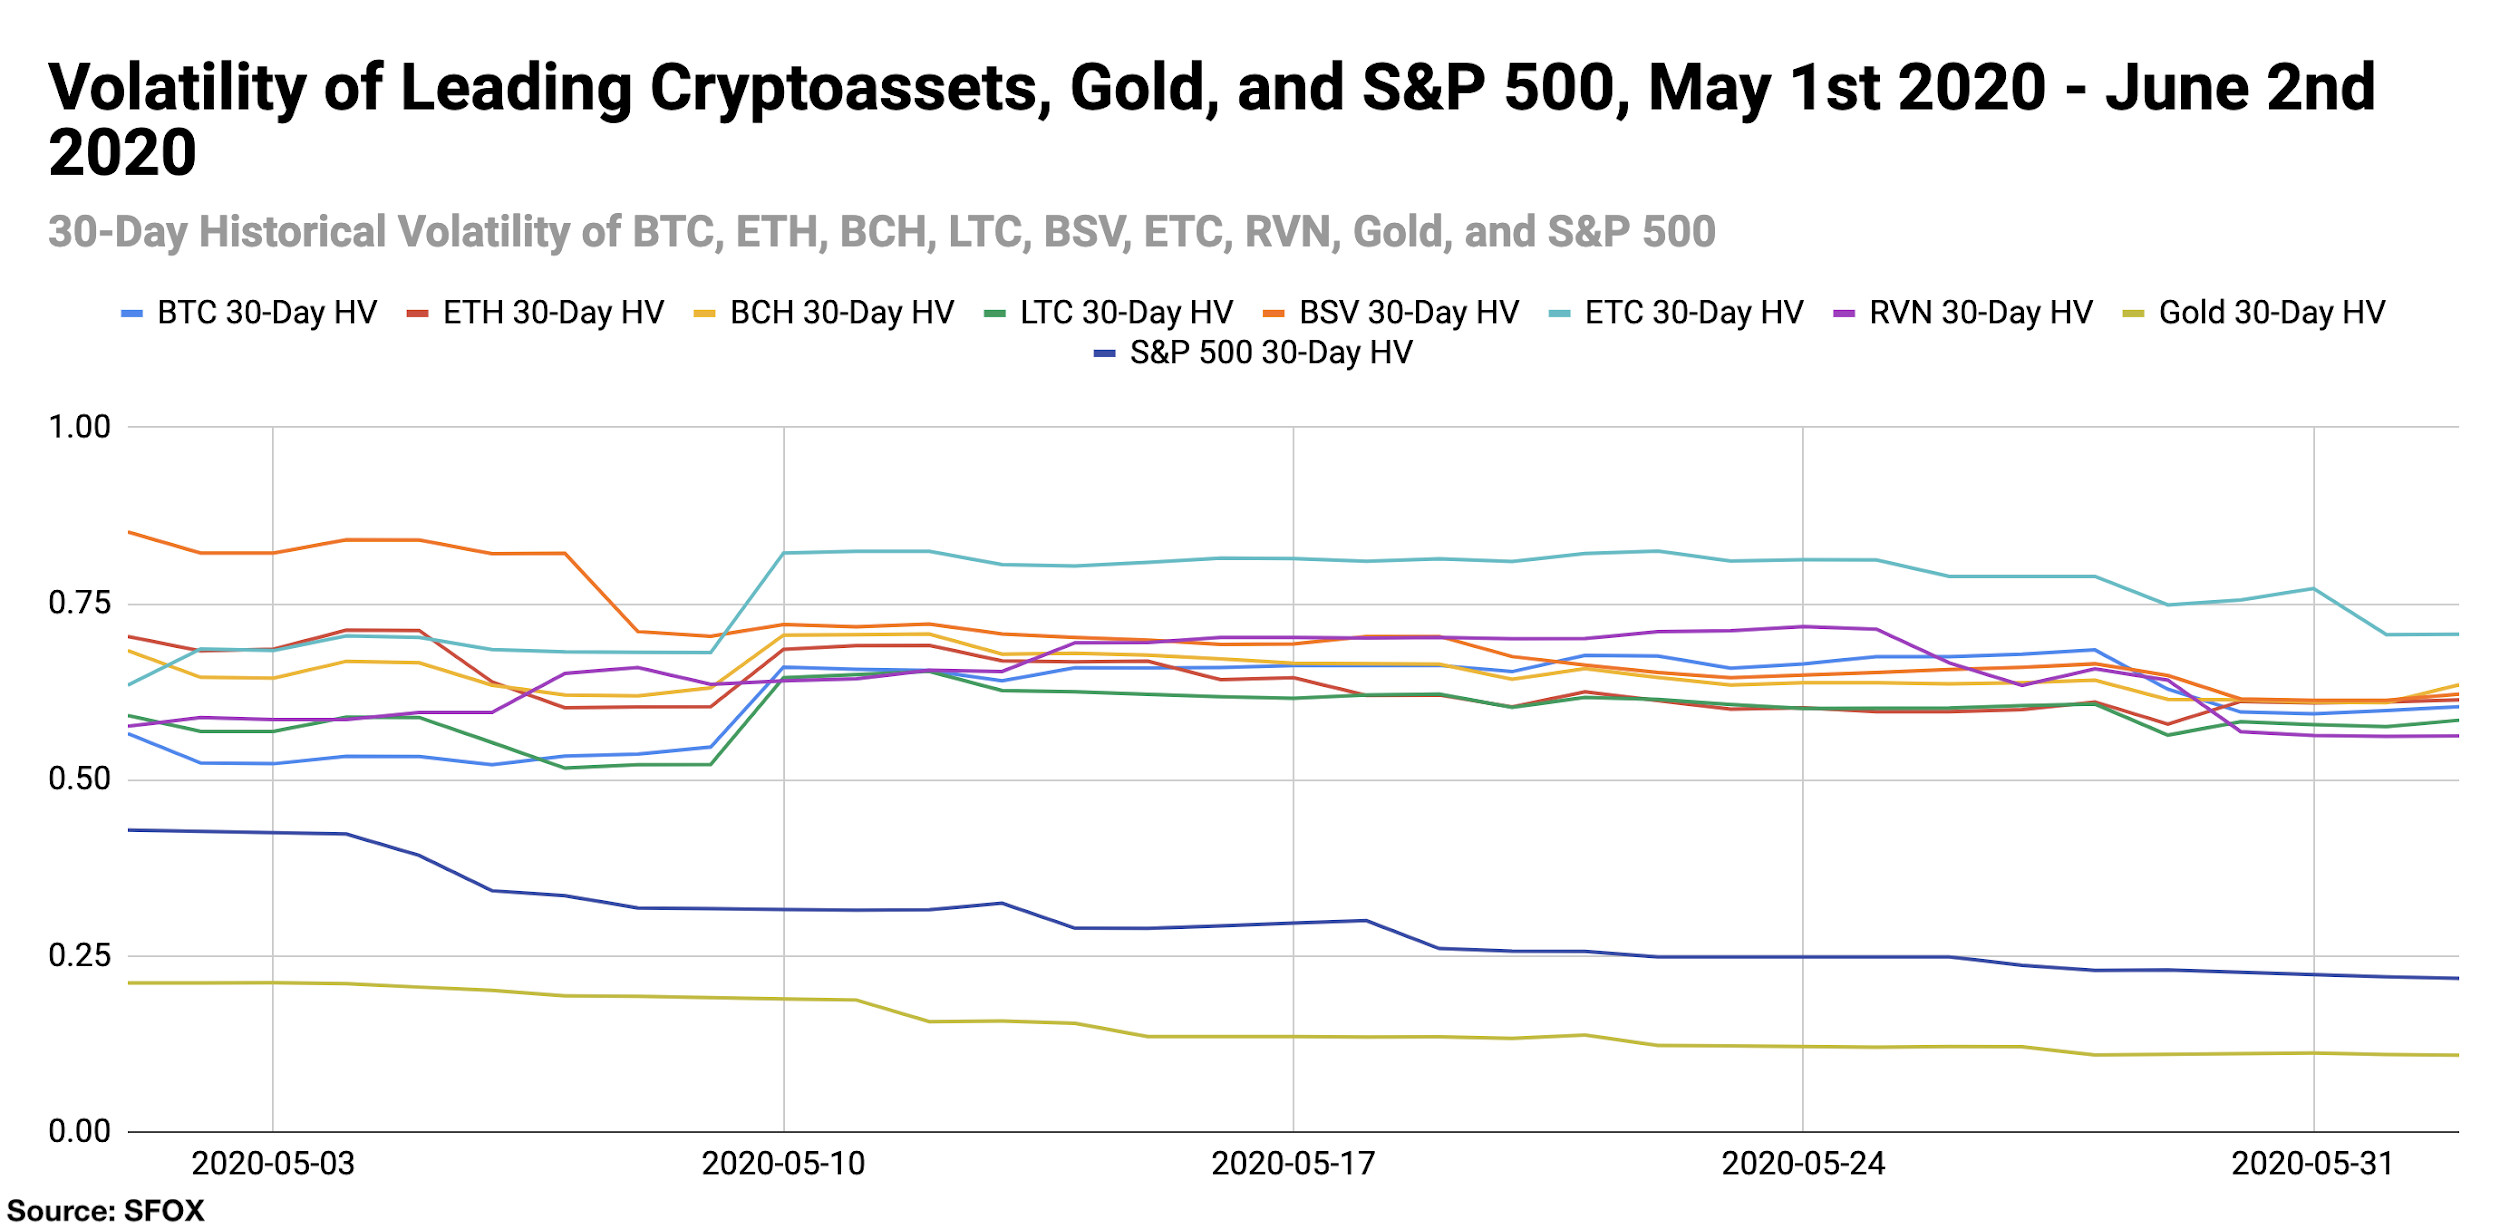
By looking at the 30-day historical volatilities of ETH, BCH, LTC, BSV, ETC, and RVN as a percentage of BTC’s 30-day historical volatility, we can see that altcoin’s volatilities all grew more closely aligned with that of BTC over the course of the month. The one outlier is ETC, which had outsized volatility relative to BTC’s as of June 2nd (a ratio of 1.17).
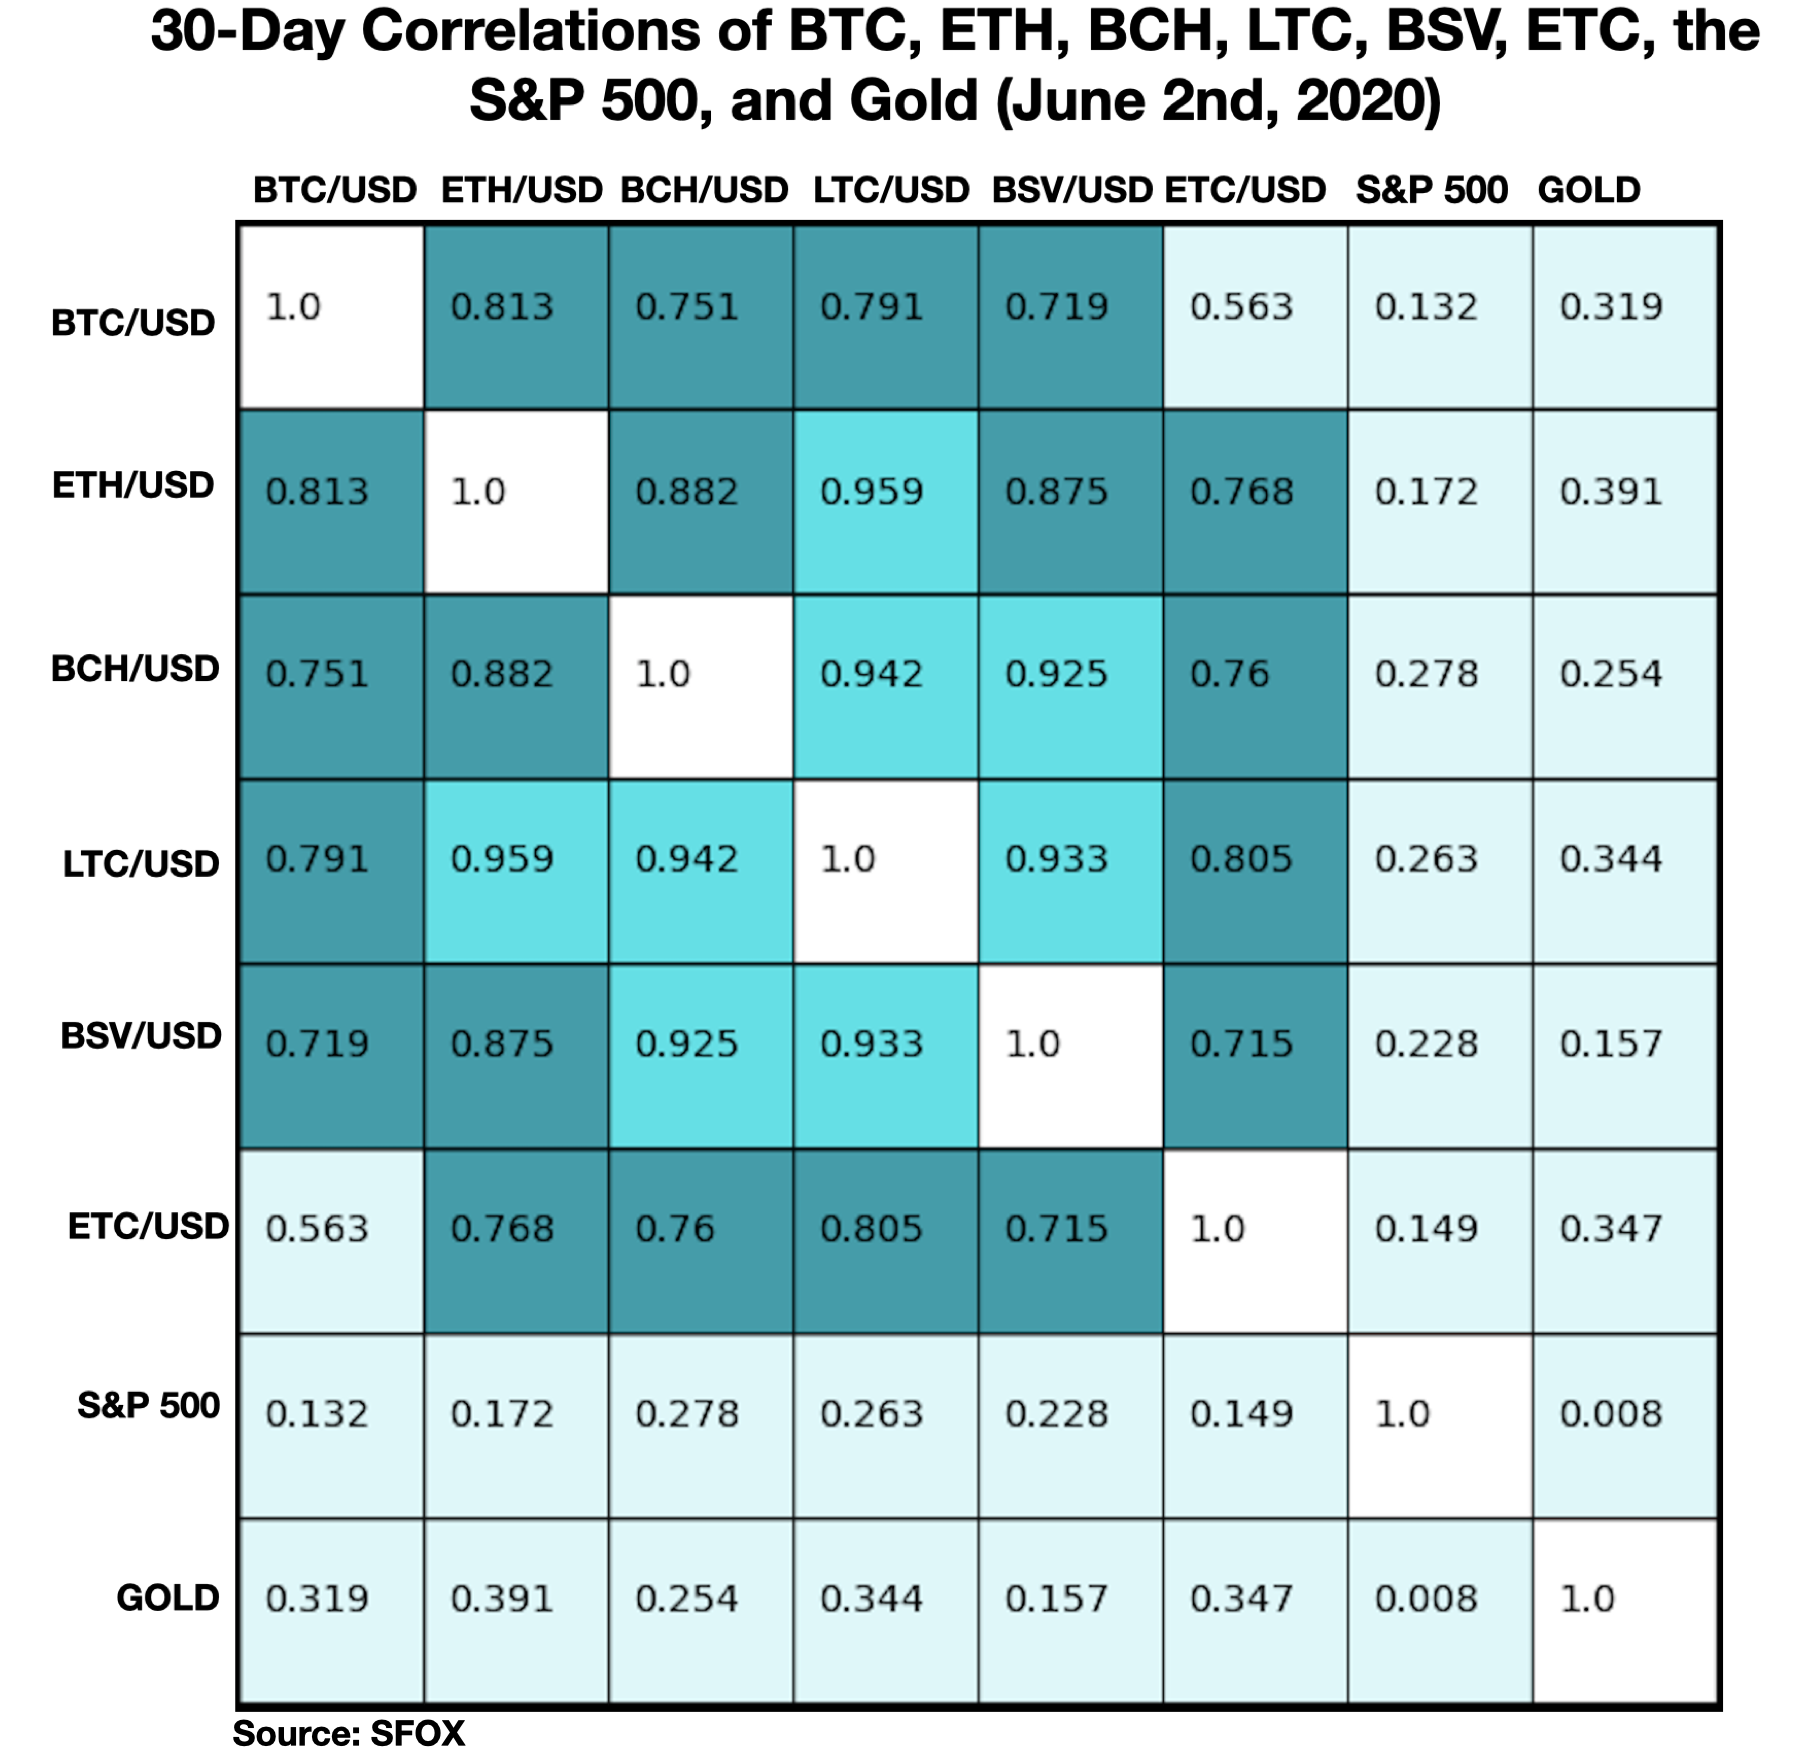
Price Correlations: Back to Separate Asset Classes
The key correlations highlight this time around is that cryptocurrencies are returning to the “norm” of being highly correlated with each other and uncorrelated with the S&P 500 and gold. As we discussed above, this is theoretically expected behavior in general, despite the fact that we did witness high BTC:S&P500 correlations in the last few months (potentially due to financial contagion from COVID-19).
See the full SFOX crypto correlations matrix below:
For a more complete look at BTC’s correlations with other assets throughout the past month, see the following graph:
Appendix: Data Sources, Definitions, and Methodology
All cryptocurrency prices are denominated in USD unless otherwise noted.
Note that data collection for RVN began on February 2nd of this year, which is why RVN is not yet featured in all data analyses. RVN is also denominated in USD for ease of analysis and comparison with other crypto assets, though most RVN trading currently happens in the RVN/BTC pair.
We use two different in-house volatility indices in creating these reports:
1. 30-day historical volatility (HV) indices are calculated from daily snapshots over the relevant 30-day period using the formula:
30-Day HV Index = σ(Ln(P1/P0), Ln(P2/P1), …, Ln(P30/P29)) * √(365)
2. Daily historical volatility (HV) indices are calculated from 1440 snapshots over the relevant 24-hour period using the formula:
Daily HV Index = σ(Ln(P1/P0), Ln(P2/P1), …, Ln(P1440/P1439))* √(1440)
S&P 500 performance data are collected from Yahoo! Finance using GSPC (S&P 500 Index) data. Gold performance data are collected from Yahoo! Finance using GC=F (June 2020 gold futures contract) data.
30-day asset correlations are calculated using the Pearson method, in accordance with the following formula:
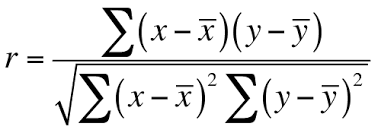
In our calculations, x = 30-day returns for BTC/USD, y = 30-day returns for the other asset in consideration, and r = the correlation coefficient between BTC and the other asset in consideration.
The crypto asset data sources aggregated for crypto prices, correlations, and volatility indices presented and analyzed in this report are the following eight exchanges, the order-book data of which we collect and store in real time:
- bitFlyer
- Binance
- Bitstamp
- Bittrex
- Coinbase
- Gemini
- itBit
- Kraken
Our indices’ integration of data from multiple top liquidity providers offers a more holistic view of the crypto market’s minute-to-minute movement. There are two problems with looking to any single liquidity provider for marketwide data:
- Different liquidity providers experience widely varying trade volumes. For example: according to CoinMarketCap, Binance saw over $20 billion USD in trading volume in November 2018, whereas Bitstamp saw $2 billion USD in trading volume in that same time — an order-of-magnitude difference. Therefore, treating any single liquidity provider’s data as representative of the overall market is myopic.
- Liquidity providers routinely experience interruptions in data collection. For instance, virtually every exchange undergoes regularly scheduled maintenance at one point or another, at which point their order books are unavailable and they therefore have no market data to collect or report. At best, this can prevent analysts from getting a full picture of market performance; at worst, it can make it virtually impossible to build metrics such as historical volatility indices.
Building volatility indices that collect real-time data from many distinct liquidity providers mitigates both of these problems: collecting and averaging data from different sources prevents any single source from having an outsized impact on our view of the market, and it also allows us to still have data for analysis even if one or two of those sources experience interruptions. We use five redundant data collection mechanisms for each exchange in order to ensure that our data collection will remain uninterrupted even in the event of multiple failures.
The above references an opinion and is for informational purposes only. It is not intended as and does not constitute investment advice, and is not an offer to buy or sell or a solicitation of an offer to buy or sell any cryptocurrency, security, product, service or investment. Seek a duly licensed professional for investment advice. The information provided here or in any communication containing a link to this site is not intended for distribution to, or use by, any person or entity in any jurisdiction or country where such distribution or use would be contrary to law or regulation or which would subject SFOX, Inc. or its affiliates to any registration requirement within such jurisdiction or country. Neither the information, nor any opinion contained in this site constitutes a solicitation or offer by SFOX, Inc. or its affiliates to buy or sell any cryptocurrencies, securities, futures, options or other financial instruments or provide any investment advice or service.