Summary:
- Crypto market participants are waiting for the halving, but they may want to look at traditional markets: BTC remains positively correlated with the S&P 500.
- ETH and ETC had higher month-over-month returns than all other major cryptocurrencies, including BTC. This may be related to increased interest in DeFi and stablecoins, which have focused on Ethereum and may be extended to Ethereum Classic.
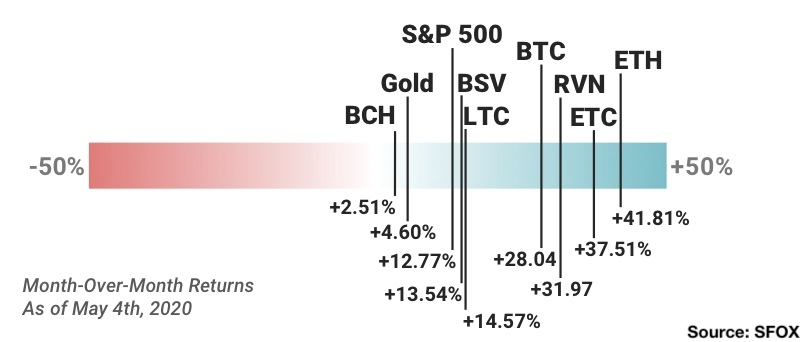
- All crypto assets are up month-over-month ahead of Bitcoin’s third block reward halving. As of May 4th, BTC was up 28.04%; ETH saw the largest month-over-month returns (41.81%), while BCH saw the smallest returns (2.51%). The S&P 500 was up 12.77% month-over-month; gold was up 4.60% month-over-month.
- The SFOX Multi-Factor Market Index has been updated from mildly bearish to neutral as of May 4th.
On this occasion, the monthly SFOX crypto market report comes just days before the historical third halving of the Bitcoin block reward. With that in mind, we’ve paid particular attention in this report to crypto market factors that either directly pertain to the halving or may run the risk of being critically overlooked during the news cycle surrounding the halving.
In the May 2020 edition of the SFOX crypto market report, the SFOX Research Team reviews the crypto market’s volatility, correlations, and other performance metrics throughout the past month. We’ve aggregated price, volume, correlations, and volatility data from eight leading exchanges and liquidity providers to analyze the global performance of 7 major crypto assets — BTC, ETH, BCH, LTC, BSV, ETC, and RVN — all of which are available for smart-routing-powered trading on our trading platform.
The following is a report and analysis of their volatility, price correlations, and further development in the month of April and early May. (For more information on data sources and methodology, please consult the appendix at the end of the report.)
SFOX’s Current Crypto Market Outlook: Neutral
Based on our calculations and analyses, the SFOX Multi-Factor Market Index, which was set at mildly bearish a month ago, has been updated to neutral as of May 7th, 2020.
We determine the monthly value of this index by using proprietary, quantifiable indicators to analyze five market factors: price momentum, trade volume, market sentiment, volatility, and continued advancement of the sector. It is calculated using a proprietary formula that combines quantified, marketwide data on asset performance, search traffic, blockchain transactions, and more. The index ranges from highly bearish to highly bullish.
All crypto assets tracked by the SFOX market report showed positive month-over-month returns as of May 4th, along with the S&P 500 and gold. Among the crypto assets available for trading on SFOX, Ether (ETH) stood out with the highest month-over-month returns (41.81%), while BCH showed the most modest gains (2.51%).
Remember that the outlook index was set at mildly bearish a month ago, so the market’s status as neutral is an upgrade in outlook. This may reflect the fact that, as the COVID-19 pandemic persists and many markets remain adversely impacted, more investors are turning (as SEC commissioner Hester Peirce observed) to crypto as an opportunity for portfolio diversification. While much about the macroeconomic forecast remains uncertain, some see factors like continued development in decentralized finance and the imminent Bitcoin halving event as reasons to be uniquely optimistic about the crypto market.
Get the SFOX edge in volatile times through our smart-routing order types that capture the best available crypto prices from all major trading venues directly from your SFOX account.
What’s Happened in the Last Month and What to Watch Next
Markets
The U.S. Treasury Department announced that it will borrow a record total of $2.999 trillion this quarter as a result of COVID-19 economic relief efforts (May 4th).
In a statement, the Treasury Department said that the increase in borrowing was primarily due to COVID-19 relief initiatives, including “expenditures from new legislation to assist individuals and businesses, changes to tax receipts including the deferral of individual and business taxes from April — June until July, and an increase in the assumed end-of-June Treasury cash balance,” While crypto proponents often point to mounting debt as an indicator of Bitcoin’s superior utility and value-retention relative to fiat currency, the price of BTC did not show any significant gains on this news, actually falling 2.7% from the previous day.
Bitcoin has maintained a positive correlation with the S&P 500, suggesting that it may still be feeling the effects of financial contagion (April 1st — May 4th).
With the increased focus on the upcoming Bitcoin block reward halving, it may be tempting to watch BTC’s price in a vacuum — yet SFOX’s marketwide analytics show that BTC has maintained a notably positive correlation of 0.40 with the S&P 500 over the last five weeks.
Especially in light of the fact that the S&P 500 and gold remain more positively correlated than normal (an average of 0.27 over the same period), this may indicate that the potential effects of financial contagion from the COVID-19 pandemic — which SFOX analyzed last month in a special report — haven’t yet passed. Given that this coming Monday marks both the opening of the stock market after a weekend and the third Bitcoin halving, this may make BTC’s upcoming movements especially interesting to watch.
Surges in crypto volatility continue to impair crypto exchange performance (April 29th).
When the price of Bitcoin rallied 15% to almost $9,000 within 17 hours on Wednesday, April 29th, CoinDesk reported that Coinbase experienced “major outages” on their website, mobile app, and API website, while Kraken experienced “website and API connectivity issues.” This follows on the heels of similar outages on trading venues like BitMEX during turbulent market conditions in March, as reported by SFOX. Market participants may wish to monitor trading venue statuses closely in the coming month, especially if the Bitcoin block reward halving event corresponds to increased crypto volatility. (SFOX, which integrates with 20 different trading venues, remains up and running even in the event that one or several exchanges experience downtime.)
Ethereum and Ethereum Classic showed the largest month-over-month returns as of May 4th, potentially reflecting sustained interest in stablecoins and DeFi.
As previously reported by SFOX, the amount of interest and capital in “decentralized finance” (“DeFi”) — Ethereum-based credit-and-lending services, powered by stablecoins — has been on the rise for several months. It’s possible that this interest in DeFi as a use-case, especially in the midst of broader financial turmoil, is a factor in the movements not only of ETH, but also of ETC. This idea is supported by the fact that ETC’s price increased 9.42% on May 2nd, when ETC Labs founder James Wo tweeted that ETC Labs is looking for stablecoin projects “to support or establish partnership.” Yaz Khoury, Director of Developer Relations at ETC Cooperative, told SFOX, “We haven’t had any teams building stablecoins specifically on ETC yet, but there’s definitely interest. As for DeFi, we have projects like Saturn Network and Commonwealth.”
Market participants may wish to keep an eye on DeFi news and ETH and ETC’s correlations with BTC to see whether this use-case leads Ethereum and Ethereum Classic to “break away” from Bitcoin in the eyes of the broader market in months to come.
Products
DeFi startup General Protocols raised over $1 million in a seed round to move the DeFi sector beyond Ethereum (May 7th).
The Singapore-based startup intends to use this funding to develop AnyHedge, described by CoinTelegraph as “an open source derivatives tool that exchanges and OTC desks can embed allowing them to create new markets with smart contracts.” They intend to build this on Bitcoin Cash, which may potentially reflect an acknowledgment of DeFi as a compelling crypto use-case and a desire to extend that use-case to other blockchains.
Regulatory
SEC commissioner and crypto proponent Hester Peirce recognized “more interest [in cryptocurrency] coming from institutional quarters” in the current economic climate (May 4th).
In a livestream as part of Crypto Finance Conference St. Moritz, Peirce noted that people and institutions who are looking to diversify their portfolios in light of the pandemic’s impact on global markets are “likely to look more to the crypto space.” Peirce has been an advocate for Bitcoin ETFs despite none being approved by the SEC as of yet; all the same, this acknowledgment of the increased attention crypto markets are getting in the current economic climate could put further pressure on regulators to provide more clarity and guidance to the sector.
Technical Developments
The third Bitcoin block reward halving is upon us (expected at ~9:00 P.M. ET, Monday, May 11th).
The amount of BTC provided for successfully mining a new Bitcoin block — or, equivalently, the rate at which new BTC are introduced from the fixed, total supply of BTC into the market — will be cut in half in a matter of days. The price of BTC breached $10,000 for the first time since February yesterday (May 7th), and crypto market participants are closely monitoring all aspects of BTC ahead of this halving. It’s worth bearing in mind, though, that significant BTC price movements happened in the months following the last two halvings, as miners adjusted to changes in the economics of their business and the market adjusted accordingly; therefore, market participants may want to keep an eye on longer-term movements in BTC following this coming Monday, not just on where BTC goes in the hours or days after the halving.
The Details: Crypto Price, Volatility, and Correlation Data, April 1st — May 4th, 2020
Price Performance: The Climb
Bitcoin (BTC) began April 2020 at the price of $6361.81 before climbing to a price range of $6700 — $7200, within which it was bound from April 2nd through April 22nd. Since then, the price of BTC has steadily climbed: at the time of last data collection on May 4th, BTC was at a price point of $8740.46; since then, it’s crossed the $10,000 threshold once (May 7th), and it is hovering at around that threshold at the time of writing.
For better visibility of ETC and RVN price movements, please consult the following graph:
BSV showed the largest single-day gains and losses in the past month, gaining 12.95% on April 8th (ahead of its block reward halving) and losing 12.10% on April 10th. Also notable is ETH’s single-day gain of 10.59% on April 6th.
For greater graphical clarity, see this additional chart tracking only the daily returns of BTC, ETH, gold, and the S&P 500:
All leading crypto assets showed month-over-month gains as of May 4th. ETH gained the most (41.81%), while BCH gained the least (2.51%). The S&P 500 was up 12.57% month-over-month, while gold was up 4.60%.
For greater graphical clarity, see this additional chart tracking only the month-over-month changes in the prices of BTC, ETH, gold, and the S&P 500:
Volatility: Settling Down
The 30-day historical volatility of all assets tracked by the SFOX crypto market report decreased in the last month — though it’s important to note that this was a decrease from extremely high volatility in the month of March. BTC’s 30-day historical volatility began April at 134.18% and stood at 53.63% as of May 4th. Overall crypto volatility is also now spread across a narrower band than it was at the beginning of April.
By looking at the 30-day historical volatilities of ETH, BCH, LTC, BSV, ETC, and RVN as a percentage of BTC’s 30-day historical volatility, we can see that altcoin’s volatilities all increased relative to BTC over the course of the month, with the most significant increase happening in the case of RVN: its BTC-relative volatility almost doubled.
Price Correlations: Still Seeing Cross-Market Correlation
We noted above, BTC is still seeing fairly positive correlations with the S&P 500 (0.45 as of May 4th). Correlations between BTC and other cryptocurrencies also remain high, ranging from values of 0.872 (BTC: BCH) to 0.7 (BTC:BSV).
See the full SFOX crypto correlations matrix below:
For a more complete look at BTC’s correlations with other assets throughout the past month, see the following graph:
Appendix: Data Sources, Definitions, and Methodology
All cryptocurrency prices are denominated in USD unless otherwise noted.
Note that data collection for RVN began on February 2nd of this year, which is why RVN is not yet featured in all data analyses. RVN is also denominated in USD for ease of analysis and comparison with other crypto assets, though most RVN trading currently happens in the RVN/BTC pair.
We use two different in-house volatility indices in creating these reports:
1. 30-day historical volatility (HV) indices are calculated from daily snapshots over the relevant 30-day period using the formula:
30-Day HV Index = σ(Ln(P1/P0), Ln(P2/P1), …, Ln(P30/P29)) * √(365)
2. Daily historical volatility (HV) indices are calculated from 1440 snapshots over the relevant 24-hour period using the formula:
Daily HV Index = σ(Ln(P1/P0), Ln(P2/P1), …, Ln(P1440/P1439))* √(1440)
S&P 500 performance data are collected from Yahoo! Finance using GSPC (S&P 500 Index) data. Gold performance data are collected from Yahoo! Finance using GC=F (June 2020 gold futures contract) data.
30-day asset correlations are calculated using the Pearson method, in accordance with the following formula:
In our calculations, x = 30-day returns for BTC/USD, y = 30-day returns for the other asset in consideration, and r = the correlation coefficient between BTC and the other asset in consideration.
The crypto asset data sources aggregated for crypto prices, correlations, and volatility indices presented and analyzed in this report are the following eight exchanges, the order-book data of which we collect and store in real time:
- bitFlyer
- Binance
- Bitstamp
- Bittrex
- Coinbase
- Gemini
- itBit
- Kraken
Our indices’ integration of data from multiple top liquidity providers offers a more holistic view of the crypto market’s minute-to-minute movement. There are two problems with looking to any single liquidity provider for marketwide data:
- Different liquidity providers experience widely varying trade volumes. For example: according to CoinMarketCap, Binance saw over $20 billion USD in trading volume in November 2018, whereas Bitstamp saw $2 billion USD in trading volume in that same time — an order-of-magnitude difference. Therefore, treating any single liquidity provider’s data as representative of the overall market is myopic.
- Liquidity providers routinely experience interruptions in data collection. For instance, virtually every exchange undergoes regularly scheduled maintenance at one point or another, at which point their order books are unavailable and they therefore have no market data to collect or report. At best, this can prevent analysts from getting a full picture of market performance; at worst, it can make it virtually impossible to build metrics such as historical volatility indices.
Building volatility indices that collect real-time data from many distinct liquidity providers mitigates both of these problems: collecting and averaging data from different sources prevents any single source from having an outsized impact on our view of the market, and it also allows us to still have data for analysis even if one or two of those sources experience interruptions. We use five redundant data collection mechanisms for each exchange in order to ensure that our data collection will remain uninterrupted even in the event of multiple failures.
The above references an opinion and is for informational purposes only. It is not intended as and does not constitute investment advice, and is not an offer to buy or sell or a solicitation of an offer to buy or sell any cryptocurrency, security, product, service or investment. Seek a duly licensed professional for investment advice. The information provided here or in any communication containing a link to this site is not intended for distribution to, or use by, any person or entity in any jurisdiction or country where such distribution or use would be contrary to law or regulation or which would subject SFOX, Inc. or its affiliates to any registration requirement within such jurisdiction or country. Neither the information, nor any opinion contained in this site constitutes a solicitation or offer by SFOX, Inc. or its affiliates to buy or sell any cryptocurrencies, securities, futures, options or other financial instruments or provide any investment advice or service.